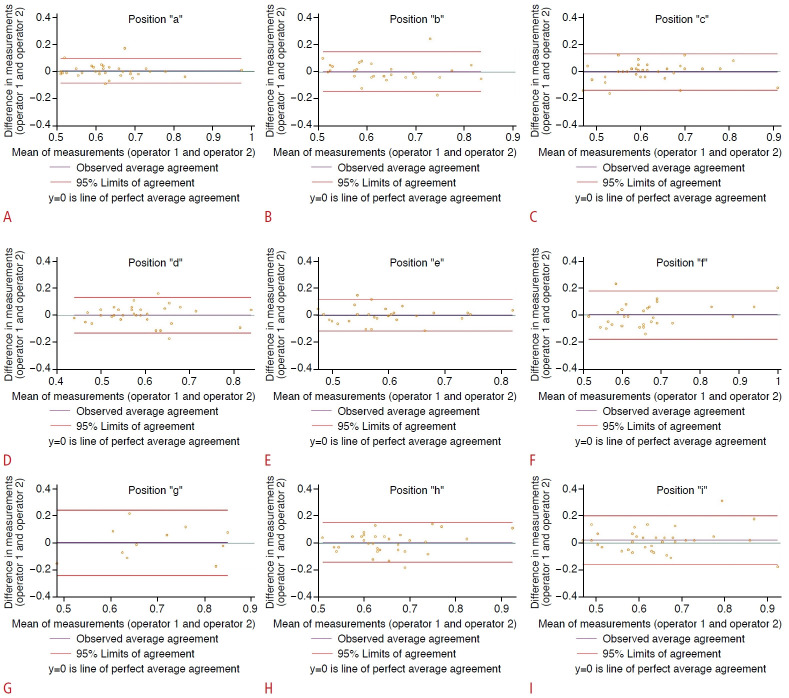
Fig. 5. Inter-observer concordance with the attenuation imaging algorithm: Bland and Altman plot of differences in measurements.
The green line (y=0) is a line of perfect average agreement. The purple line represents the mean of the difference in measurements. The red lines define the limits of agreement (mean of the difference [2 standard deviations]). Results of position "a" (A), position "b" (B). position "c" (C). position "d" (D), position "e" (E), position "f" (F), position "g" (G), position "h" (H), and position "I" (I) are shown.

