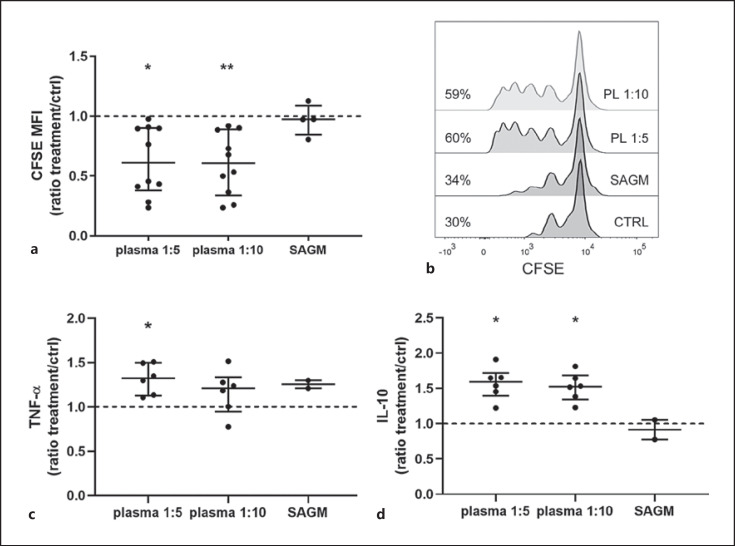
Fig. 6.
Diluted plasma (PL; a n = 4 and c, d n = 3 individual donors) mimicking residual plasma in SN within RBC units augmented T-cell proliferation (a, b). CFSE-labeled PBMCs (n = 4) were stimulated with anti-CD3 for 4 days. CFSE is halved with each cell division; a lower CFSE MFI indicates augmented proliferation. a Both dilutions of plasma enhanced proliferation significantly in relation to control (PL 1:5 p = 0.016, PL 1:10 p = 0.003). Plasma was diluted in storage solution SAGM 1:5 and 1:10 to imitate residual plasma in RBC SN. b Representative example of T-cell proliferation of the same PBMCs exposed to the two different dilutions of plasma. Percentages of proliferating cells from lymphocyte population are shown. c, d In comparison to control, diluted plasma increased LPS-stimulated PBMCs TNF-α (c) (PL 1:5 p = 0.04) and IL-10 (d) secretion (PL 1:5 p = 0.04, PL 1:10 p = 0.04). The data are presented as median (IQR). MFI, median fluorescence intensity.

