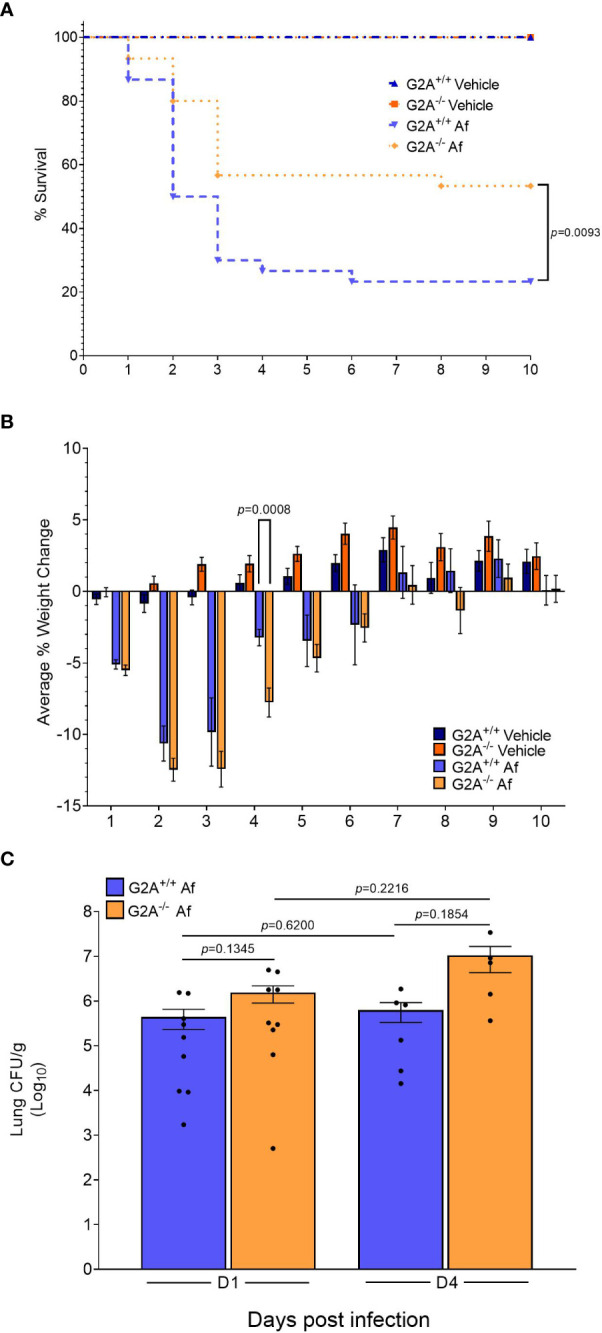
Figure 2.

Survival advantage for immunocompetent G2A-/- mice. An immunocompetent model was used to assess differences in survival (A) between G2A+/+ and G2A-/- mice. Infection with A fumigatus is represented in the graph as Af. Pooled samples from three independent studies for G2A+/+ Vehicle (n=22, dark blue triangle), G2A-/- Vehicle (n=22, dark orange square), G2A+/+ Af (n=30, blue upside-down triangle), and G2A-/- Af (n=30, orange diamond) are shown as percent survival over time (days). A log-rank (Mantel-Cox) test was used to assess statistical differences. The statistical difference between G2A+/+ Af and G2A-/- Af is shown as a p value. Weight changes were tracked over time for all the above mentioned groups and shown as average percent weight change ± SEM (B). Statistical differences were assessed between all groups using the Student’s t test with Welch’s correction and samples that were statistically different between G2A+/+ Af and G2A-/- Af is listed as a p value. Fungal burden (C) was assessed from a subset of samples at D1 and D4 post-infection via CFU/g lung tissue. The average ± SEM is shown with individual mice shown as circles within the bar graphs. Statistical differences were assessed via the Student’s t test using Welch’s correction and p values are listed to denote differences between G2A+/+ and G2A-/- mice.
