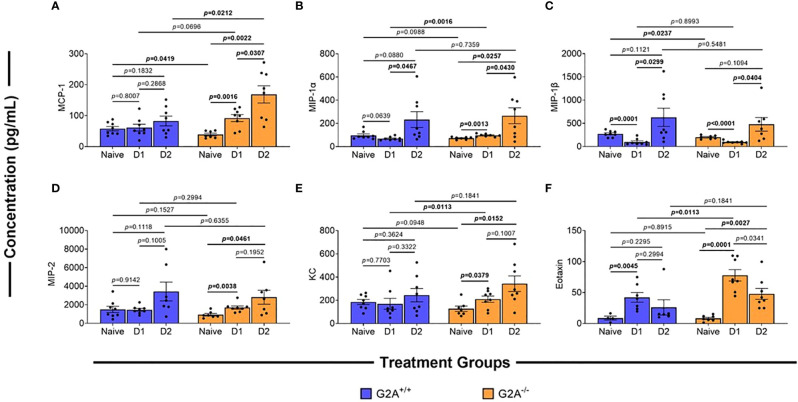
Figure 3.
Differences in chemokines of G2A-/- mice in comparison to wild-type. Cells were isolated from lungs of naïve, D1, and D2 samples post-infection of G2A+/+ (blue bars) and G2A-/- (orange bars) mice. Cells were incubated for 24h in modified IMDM. Supernatants were collected and analyzed using multiplex analysis to assess inflammatory chemokines MCP-1 (A), MIP-1α (B), MIP-1β (C), MIP-2(D), KC (E), and Eotaxin (F). Concentrations (pg/mL) are listed as average protein ± SEM from two independent studies pooled (individual values, circles). Statistical differences were assessed using the Student’s t test with Welch’s corrections with p values listed on graphs.

