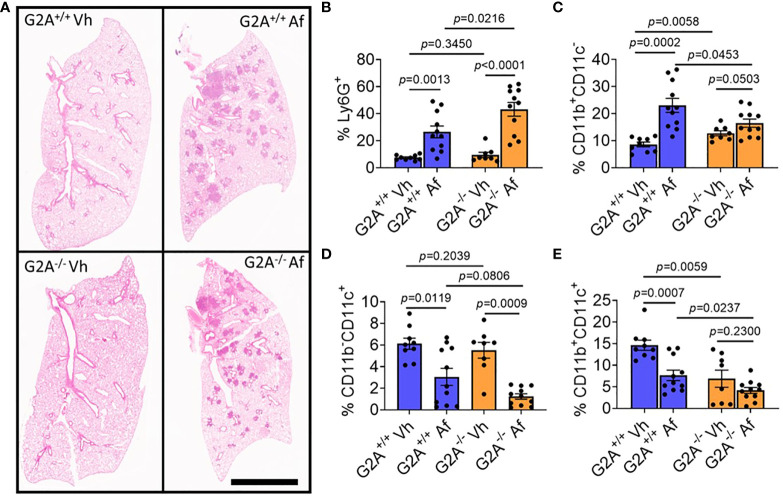
Figure 4.
No pathological differences in inflammation, but significant differences in the myeloid population including increased neutrophilia for G2A-/- mice. Representative photomicrographs of lungs from G2A+/+ Vh and A. fumigatus (Af) infected lungs (A, top) and G2A-/- Vh and Af (A, bottom) are shown of H&E-stained samples. Cells isolated from lungs at D1 p.i. were assessed using flow cytometry in which populations of myeloid cells were categorized from total CD45+ cells. Percent of Ly6G+ cells (neutrophils, B), Ly6G-CD11b+CD11c- cells (monocytes, macrophages, and eosinophils, C), Ly6G-CD11b-CD11c+ (alveolar macrophages and dendritic cells, D), and Ly6G-CD11b+CD11c+ (dendritic cells, E) from G2A+/+ Vh or Af (blue bars) and G2A-/- Vh or Af (orange bars) are shown as average percent ± SEM with individual samples (circles) shown. Statistical differences were determined using the Student’s t test with Welch’s correction. P values are listed within the graphs comparing groups.

