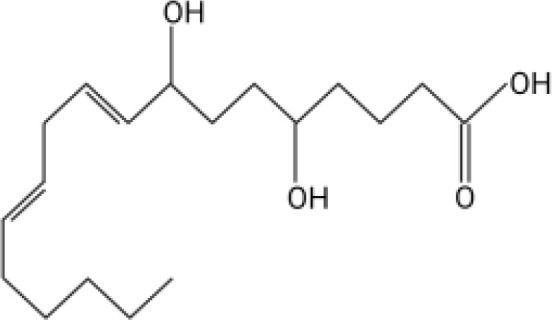
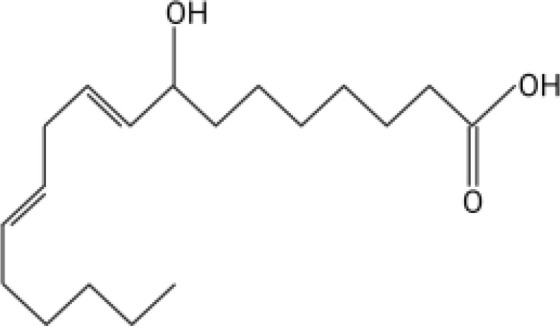
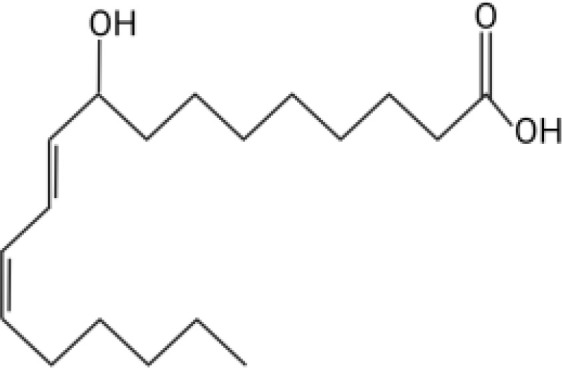
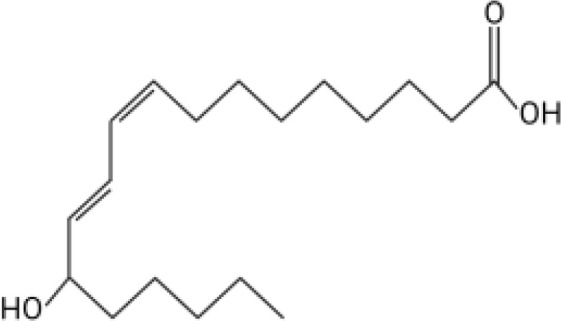
Table 1.
Oxylipin production in A. fumigatus infected lung.
| Oxylipin | Structure | Naïve (nmol/g lung) | D2 (nmol/g lung) | D3 (nmol/g lung) |
|---|---|---|---|---|
|
5,8-diHODE |

|
0.022 ± 0.02 | 5.28 ± 3.92 |
3.21 ± 1.47 |
|
8-HODE |

|
0.470 ± 0.09 |
127.6 ± 76.4 |
60.4 ± 29.6 |
|
9-HODE |

|
0.217 ± 0.05 | 1.12 ± 3.4 | 0.124 ± .033* |
|
13-HODE |

|
0.180 ± 0.04 | 0.972 ± 0.31 | 0.163 ± .05 |
*Represents statistical differences between D2 and D3 p.i.
Concentrations are listed as averages ± SEM.
