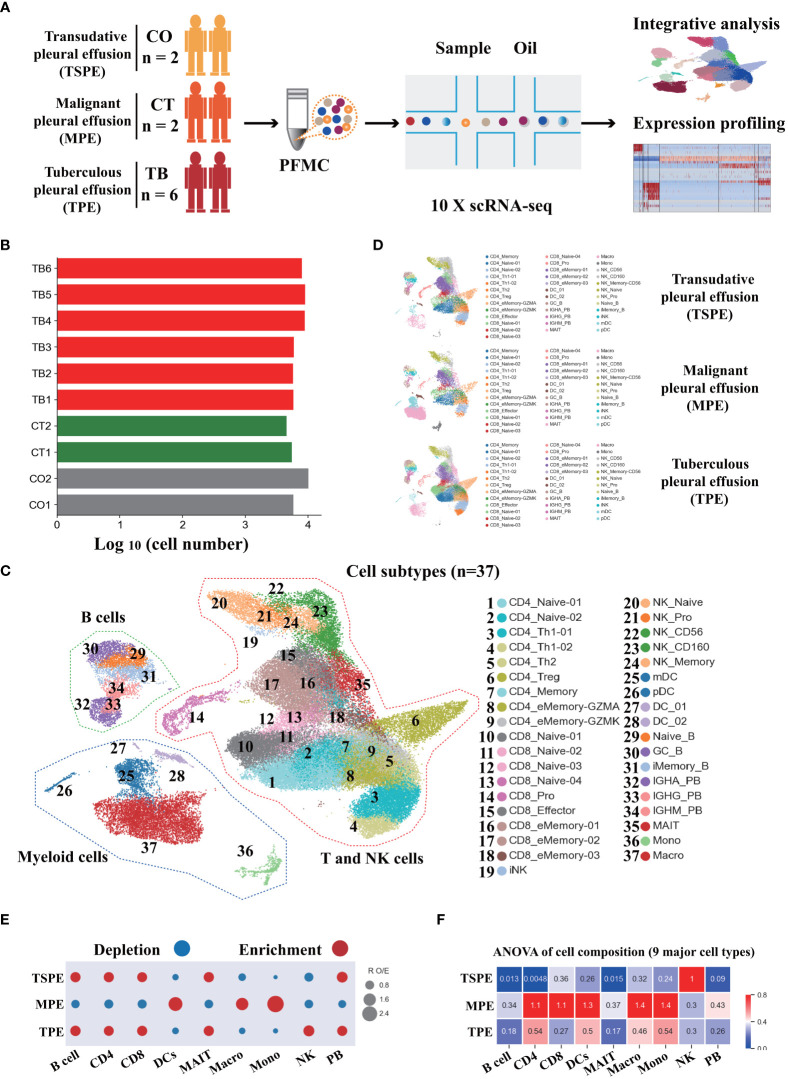
Figure 1.
Study design and overall results of single-cell transcriptional profiling of PFs from participants. (A) Schematic diagram of the overall study design. 10 subjects, including 2 patients with transudative pleural effusion (TSPE), 2 patients with malignant pleural effusion (MPE) and 6 patients with tuberculous pleural effusion (TPE). (B) Bar plot shows the log10 transformed cell number of each sample. Red represents the 6 patients with TPE, grey represents the 2 patients with TSPE, and green represents the 2 patients with MPE. (C) The clustering result of 37 cell subtypes from 10 individuals. Each point represents one single cell, colored according to cell type. (D) The UMAP projection of the 37 cell subtypes in each of the three conditions. Cells are colored by the 37 cell subtypes. (E) Disease preference of major cell clusters estimated by RO/E. (F) Heatmap for q values of ANOVA for disease severity.

