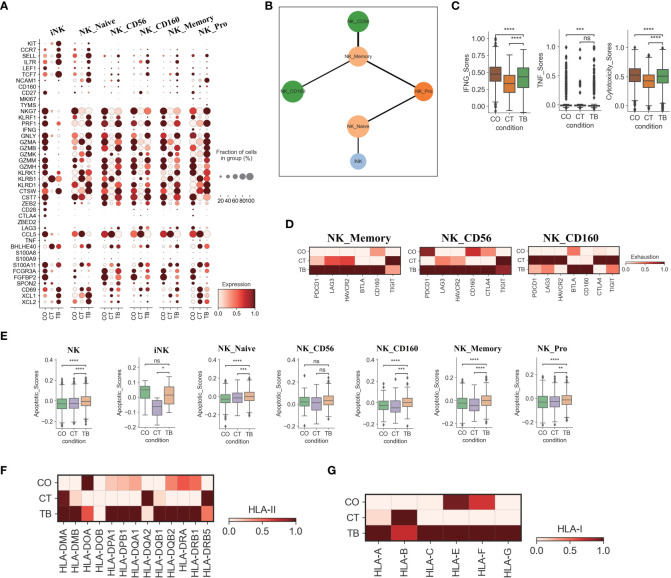
Figure 3.
Characterization of gene expression differences in NK cells across three conditions. (A) Dot plots showing the expression of selected genes in each NK cell subtype per condition. (B) PAGA analysis of NK cell pseudo-time: the associated cell type is shown. (C) Box plots of the expression of IFNG, TNF and cytotoxicity scores in NK cells per condition. (D) Heatmap plots of the expression of selected exhaustion associated genes in NK_memory, NK_CD56 and NK_CD160 cells per condition. (E) Box plots showing the apoptotic scores in NK cells and subtypes per condition. (F) Heatmap plots of HLA-II molecules in NK cells per condition. (G) Heatmap plots of HLA-I molecules in NK cells per condition. Student’s T-test was applied to test significance in (A-E). *p<0.05, **p<0.01, ***p<0.001, ****p<0.0001, nsp>0.05.

