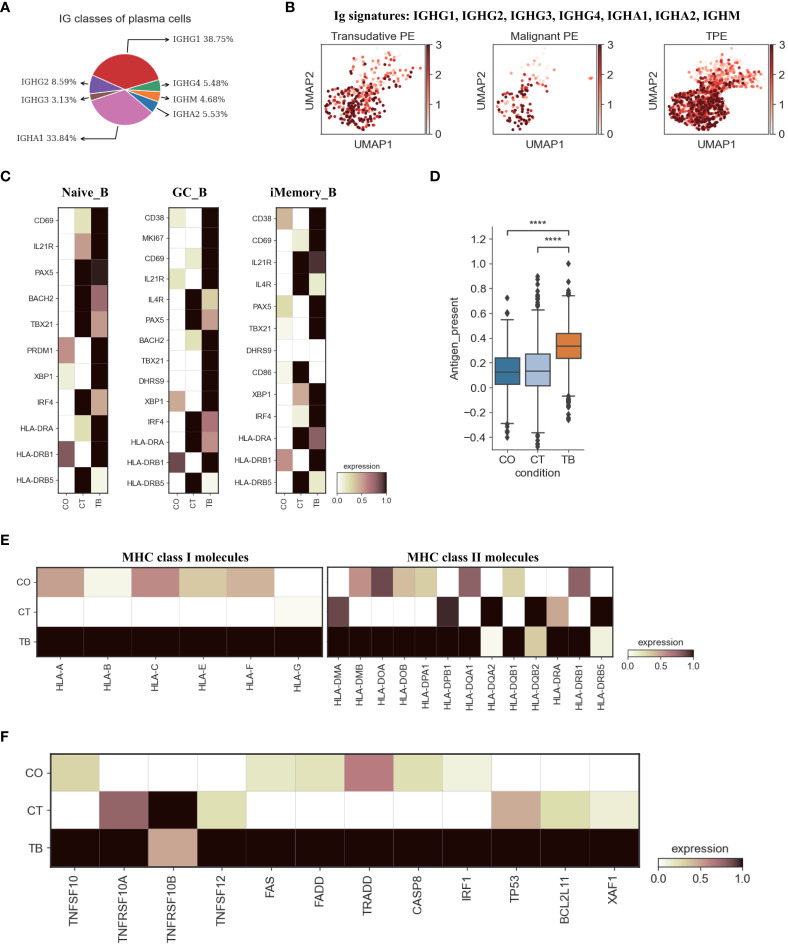
Figure 5.
Characterization of gene expression differences in B cells across three conditions. (A) Proportion of heavy chain classes identified in plasma cells. (B) UMAP plots of mean gene expression from Ig signature genes in plasma cells, split by condition. (C) Heatmap showing the expression of selected B cell activation-associated genes in Naïve_B, GC_B and iMemory_B cell subset per condition. (D) Box plot showing the antigen presentation scores in B cells across three conditions. (E) Heatmap showing expression of HLA-I and HLA-II molecules in B cells across three conditions. (F) Heatmap of the expression of apoptosis-related genes in B cells across three conditions. Student’s T-test was applied to test significance in (D) ****p<0.0001.

