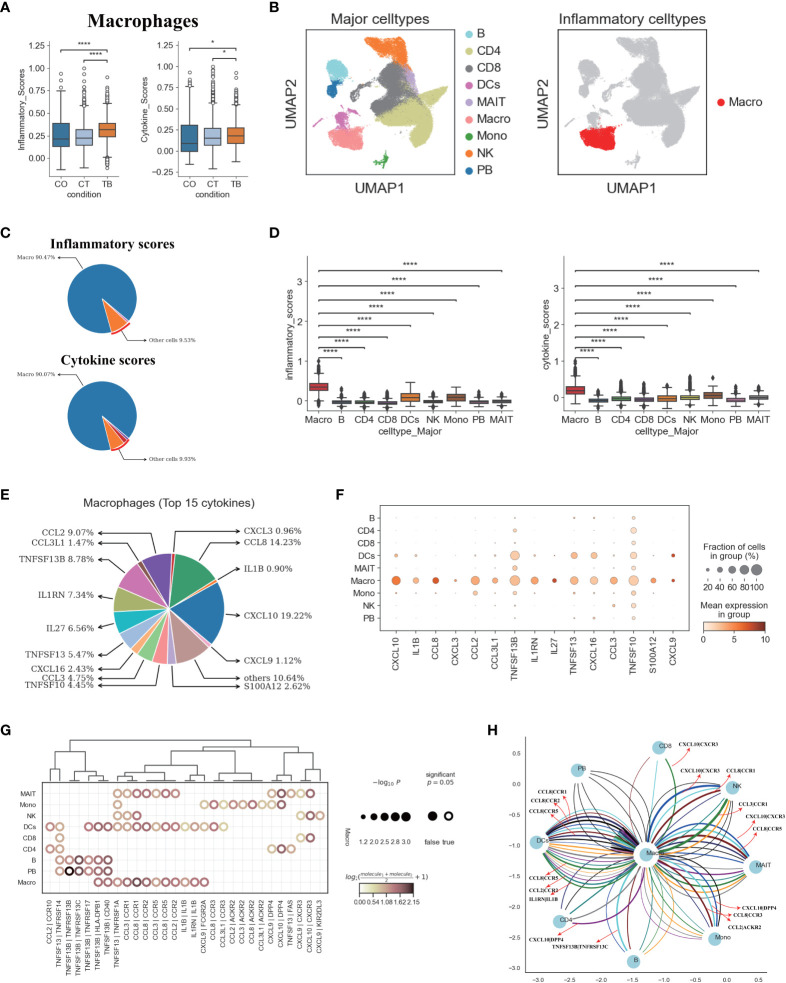
Figure 6.
Macrophages in TPE as key cellular sources for inflammatory cytokines (A) Box plots of the inflammatory and cytokine scores in macrophage across three conditions. Student’s T-test was applied to test significance. *p<0.05, ****p<0.0001. (B) UMAP plots of PFMCs colored by: major cell types (Left panel) and inflammatory cell type (Right panel). (C) Pie charts showing the relative percentage contribution of each cell type to the inflammatory score (Top panel) and cytokine score (Bottom panel). (D) Box plots of inflammatory scores (Left panel) and cytokine scores (Right panel) in nine major cell types. (E) Pie charts showing the relative percentage contribution of each pro-inflammatory cytokine in macrophages from TPE. (F) Dot plot showing the expression of selected pro-inflammatory cytokines in TPE across nine major cell types. (G) Dot plot of the interactions between macrophages and other immune cell types in patients with TPE. P values are indicated by the circle sizes, as shown in the scale on the right. (H) Macrophage-other immune cell interaction network in patients with TPE. Interactions with P values <0.05 are shown. Representative ligand-receptor interactions between macrophages and other immune cell types are marked.

