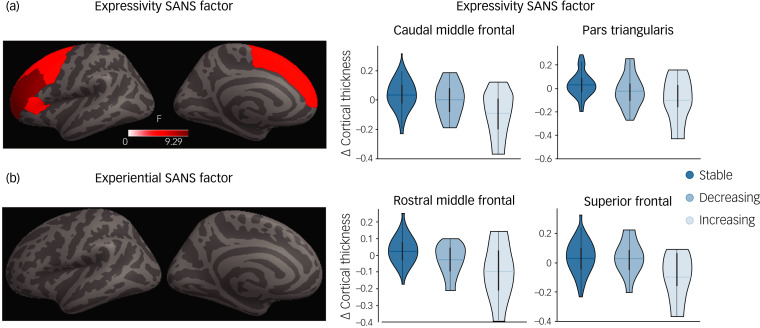
Fig. 3.
Regional long-term cortical thickness changes for expressivity and experiential factors on the Scale for the Assessment of Negative Symptoms (SANS). Regions showing significant group effects (stable, decreasing, increasing trajectories) in long-term cortical thickness changes for expressivity (a) and experiential (b) factors. The scatter plots of longitudinal cortical thickness changes by region show a significant group effect for expressivity.

