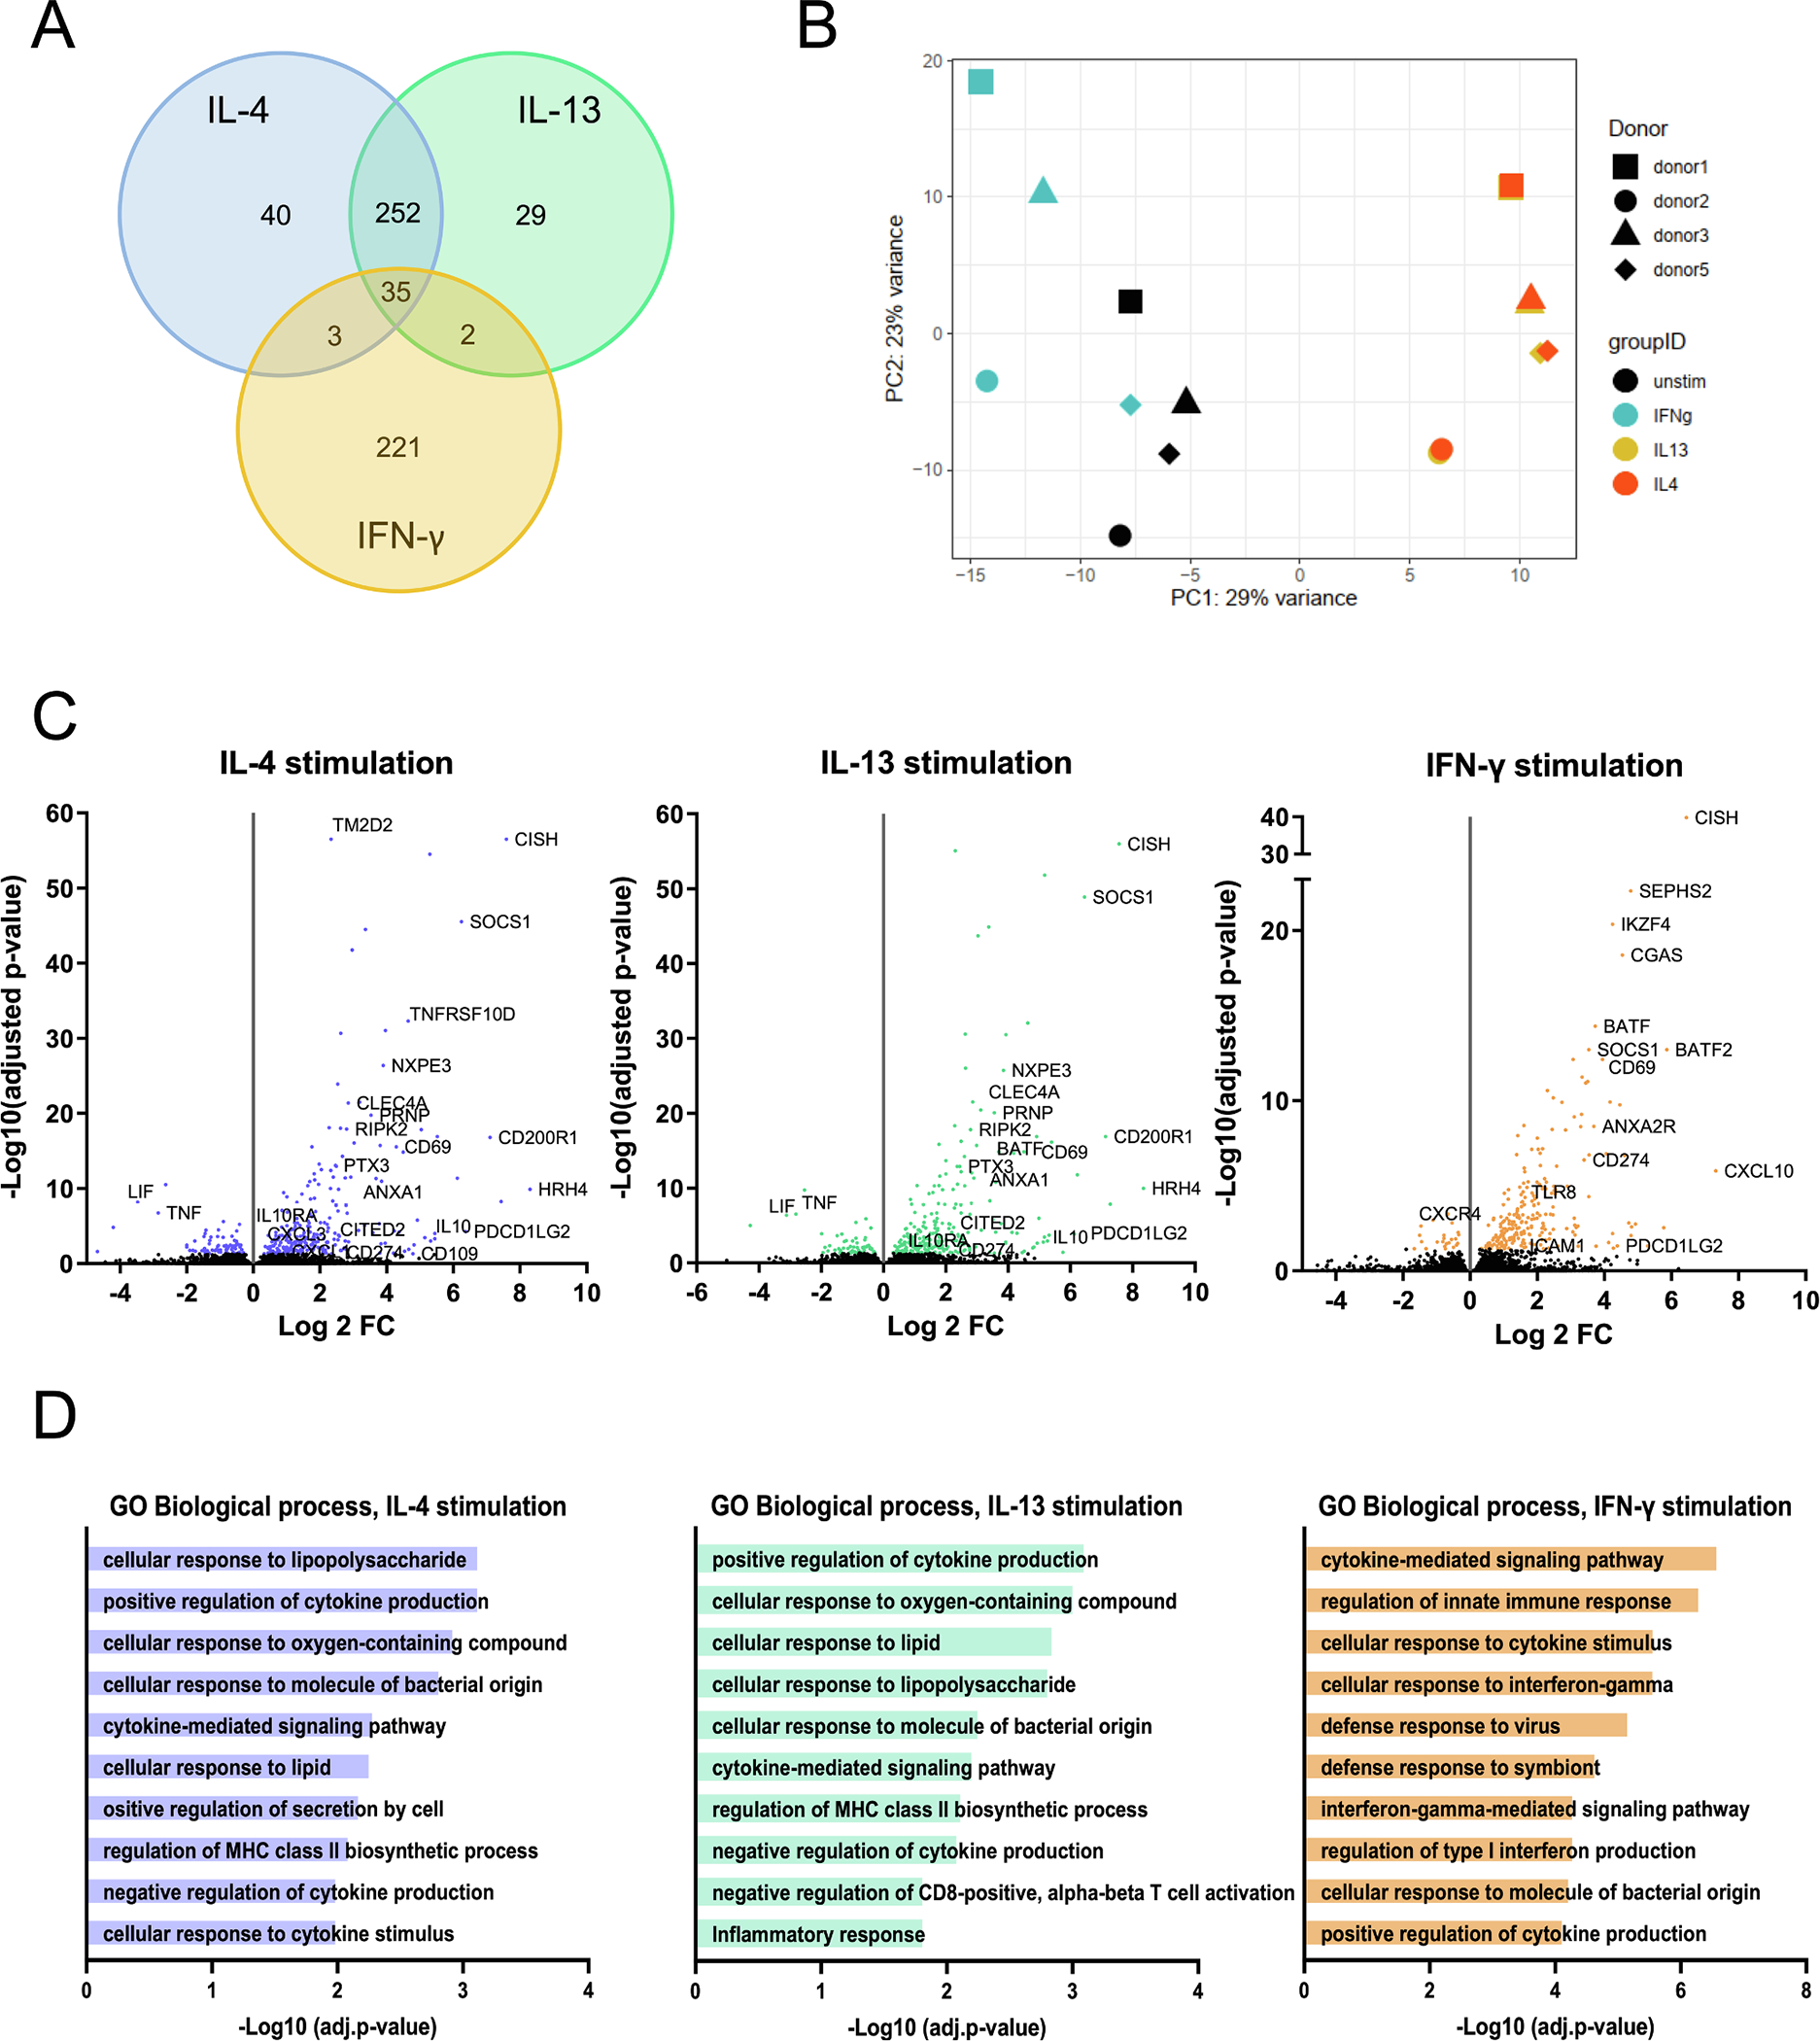
Fig. 2. RNA sequencing analysis of up- and downregulated genes in human neutrophils after stimulation with IL-4, IL-13 or IFN-γ.

(A) Venn diagram of genes regulated in human neutrophils after different stimulations. (B) Principal component analysis of stimulations and donors. (C) Volcano plots of IL-4-, IL-13- and IFN-γ-regulated genes in human neutrophils. Genes with a cutoff of false discovery rate of 5 % are shown (colored dots). (D) Genes up- and downregulated upon stimulation with IL-4, IL-13 or IFN-γ were analyzed using Enrichr. Ten Gene Ontology biological processes with the smallest adjusted p-values are shown for each stimulation. Fisher exact test was used for the calculation of p-values and correction for multiple comparisons was performed with the Benjamini-Hochberg method.
