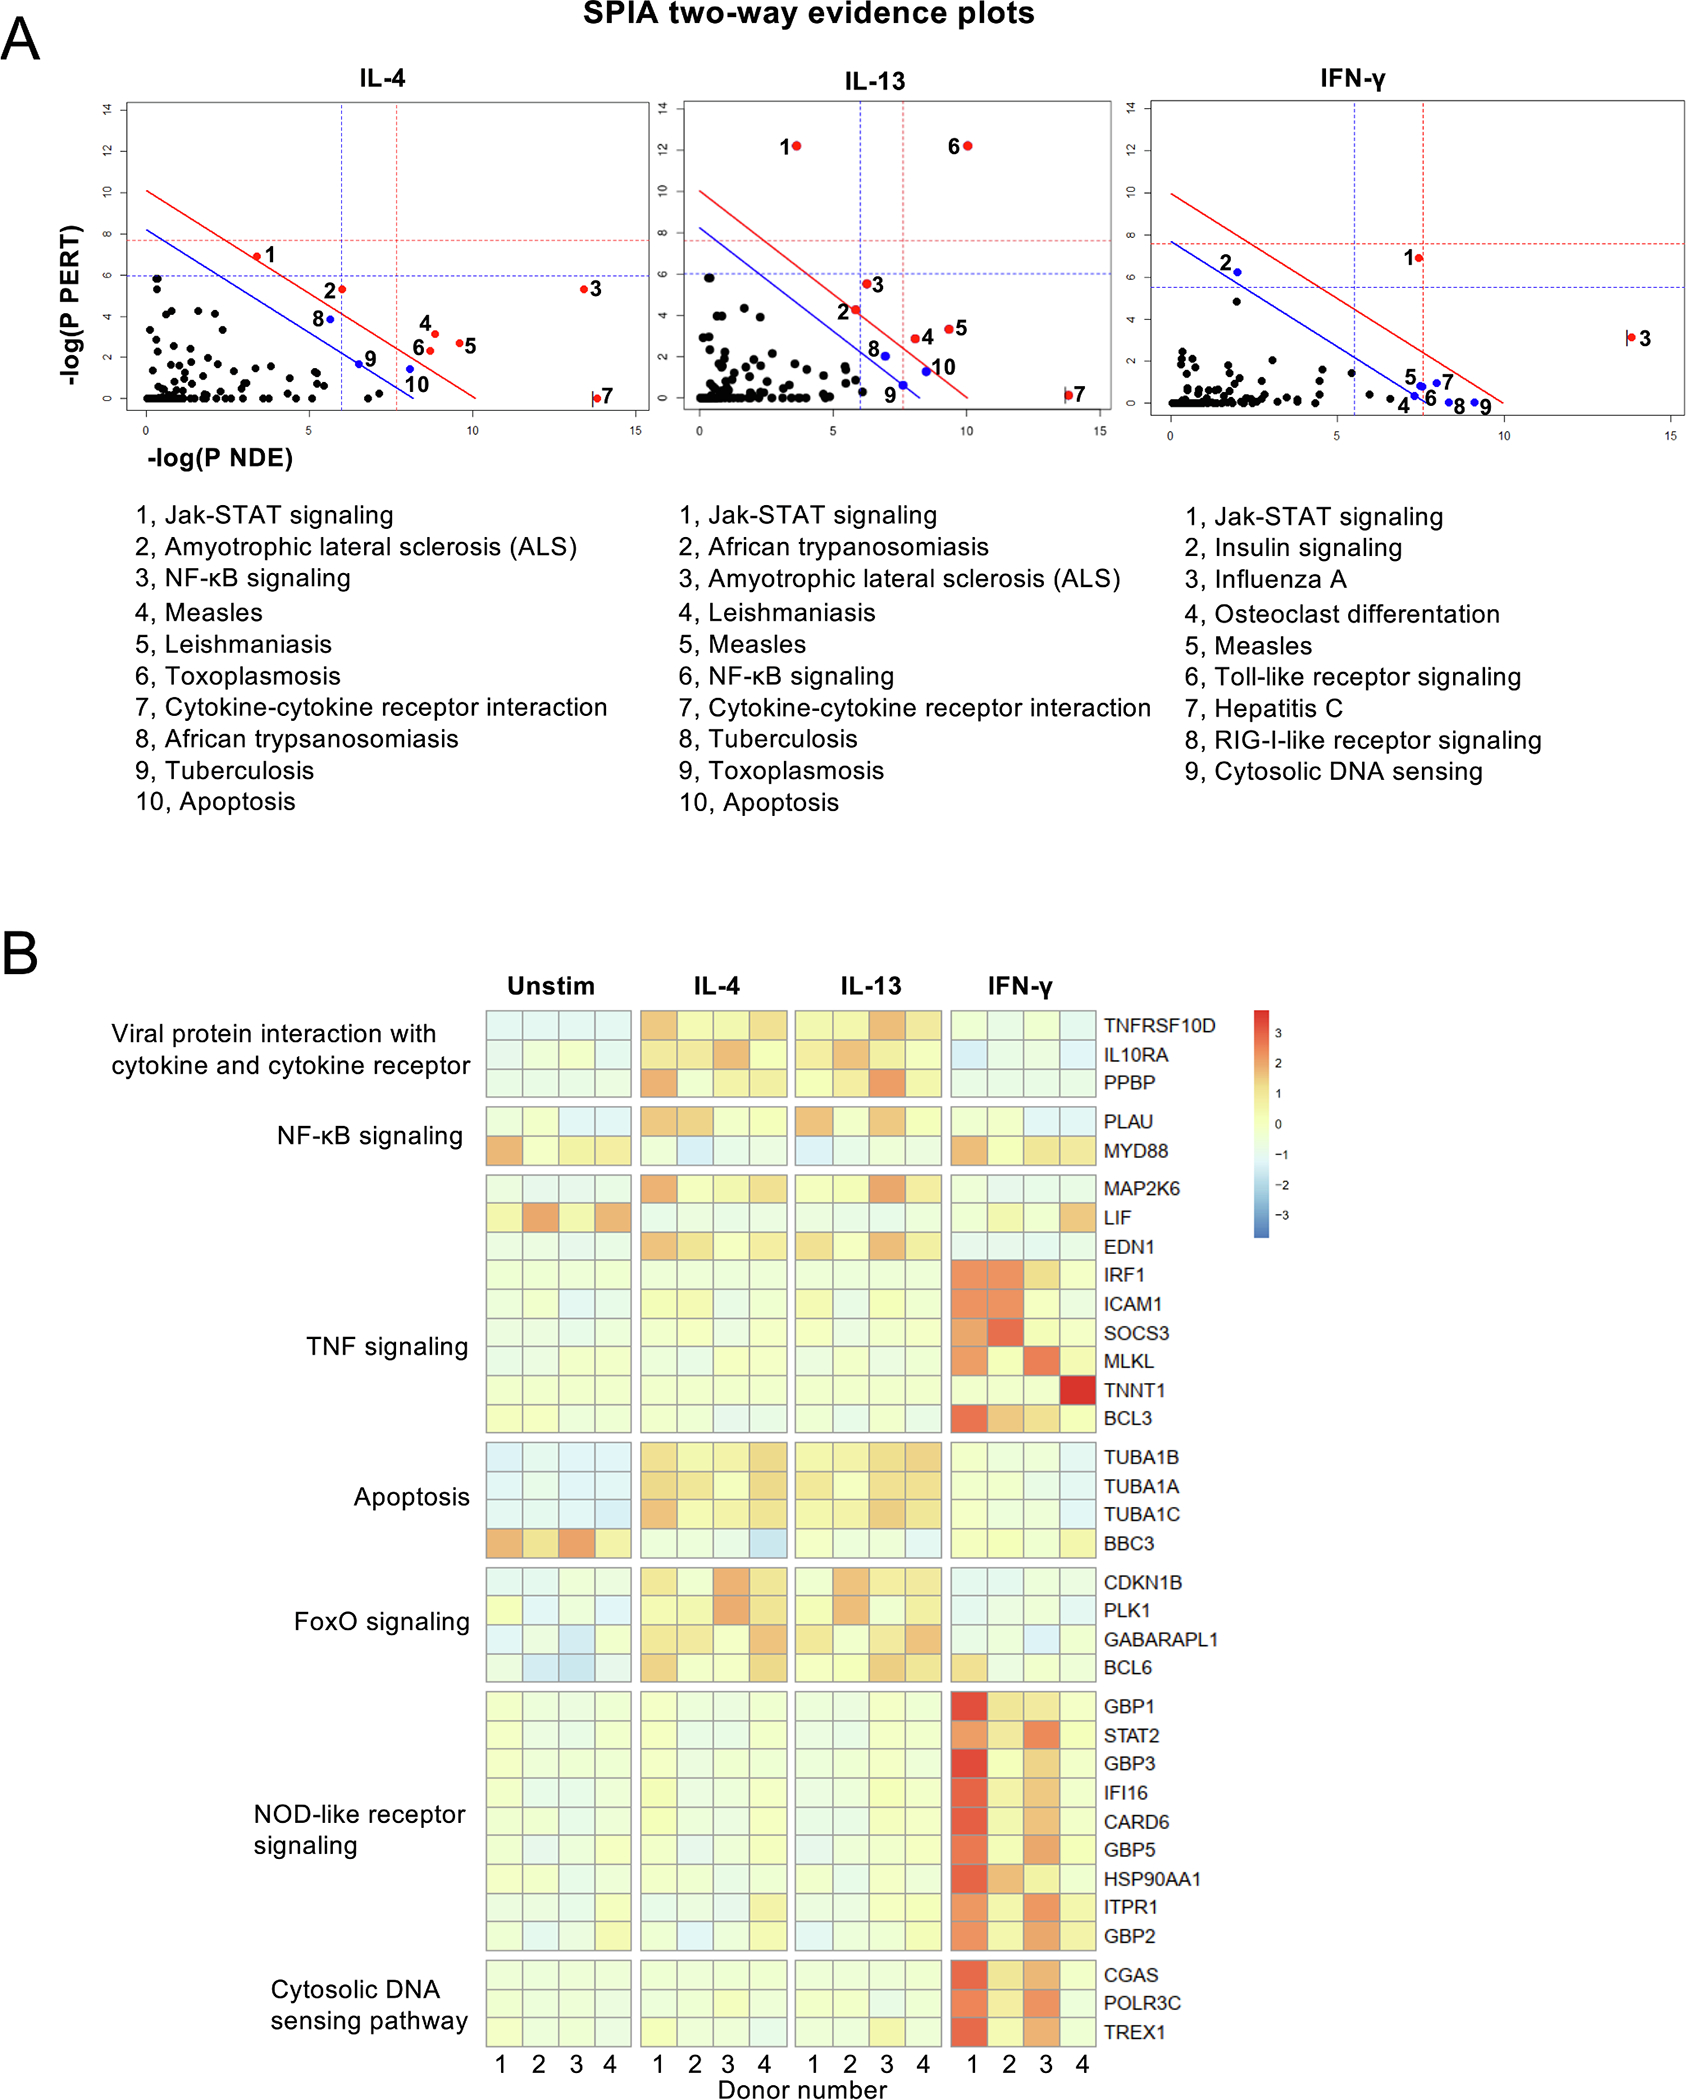
Fig. 3. Analysis of differentially expressed genes.

Messenger RNA of unstimulated, IL-4, IL-13 or IFN-γ stimulated neutrophils was analyzed using RNASeq. Differential gene expressions were tested applying DESeq2. (A) Signaling pathway impact analysis (SPIA). Two-dimensional plots illustrating the relationship between the two types of evidence considered by SPIA. The X-axis shows the over-representation evidence, while the Y-axis shows the perturbation evidence. Dots represent KEGG pathways. Red dots mark pathways significant at 5 % after Bonferroni correction, blue dots mark significantly enriched pathways (p < 0.05) according to FDR correction. (B) Heatmap of differentially expressed genes. Shown genes were selected based on differential expression (p < 0.05) and occurrence in only one KEGG pathway.
