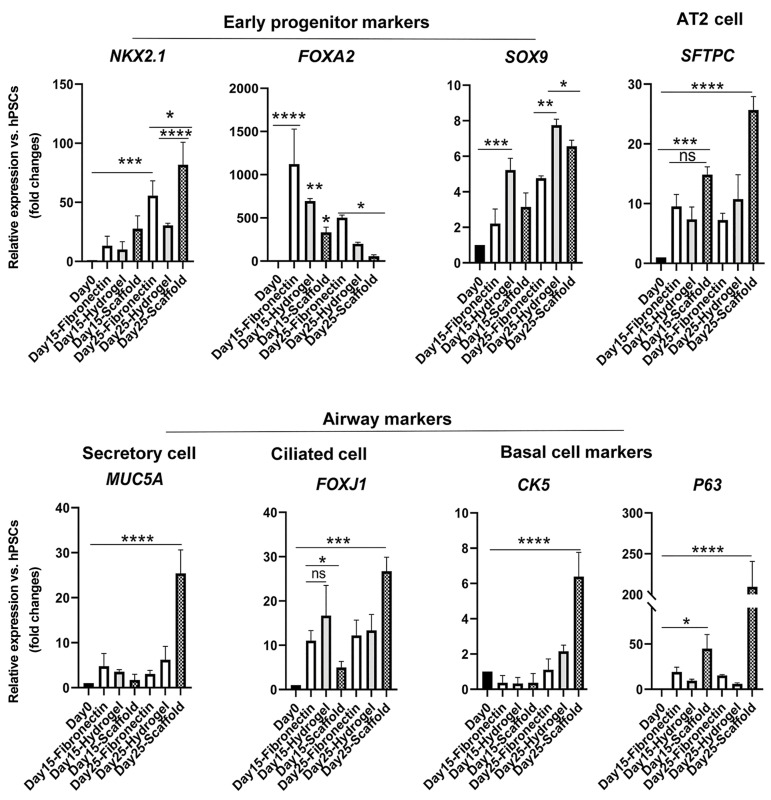
Fig.4.
Quantitative RT-PCR analysis at days 0, 15, and 25 of differentiation. Quantitative RT-PCR analysis was conducted for undifferentiated hESCs and day 15 and 25 of differentiated cells. The expression level of the target gene was normalized to GAPDH and presented relative to hESC. Data are presented as mean ± SD. Significant difference was identified using the t test with unequal variance (n=3). RT-PCR; Real-time-polymerase chain reaction, hESCS; Human embryonic stem cells, ns; Not significant, *; P<0.05, **; P<0.01, ***; P<0.001, and ****; P<0.0001.

