
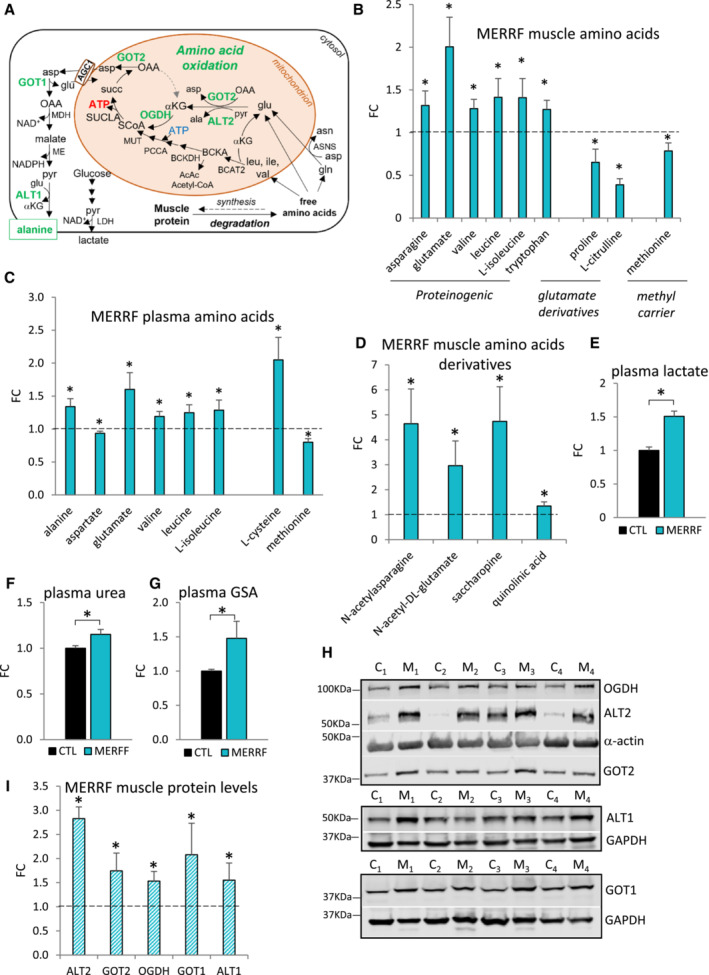
Figure 1. Glutamate oxidation through the TCA cycle is upregulated in MERRF muscle.
-
ASchematic representation of amino acid oxidation in OXPHOS‐defective MERRF muscle. Enzymes of amino acid utilization in green are upregulated in MERRF, as detected by western blot analysis. αKG, α‐ketoglutarate; ala, alanine; asn, asparagine; asp, aspartate; BCKA, branched chain keto acids; glu, glutamate; gln, glutamine; ile, isoleucine; leu, leucine; val, valine; OAA, oxaloacetate; pyr, pyruvate; succ, succinate; SCoA, succinyl‐CoA.
-
B, CLevels of differential free amino acids in MERRF patients' muscle (B) and plasma (C) by LC–MS analysis, expressed relative to CTL.
-
DLevels of amino acid derivatives in MERRF muscle by LC–MS analysis, expressed relative to CTL.
-
E–GPlasma levels of lactate (E), urea (F), and guanidinosuccinic acid (GSA) (G) by LC–MS analysis, expressed relative to CTL value set at 1.
-
HWestern blots of muscle lysates separated by denaturing SDS–PAGE and probed for OGDH, ALT2, α‐actin, and GOT2 (top panel), ALT1 and GAPDH (middle panel), GOT1 and GAPDH (bottom panel), C (CTL), M (MERRF).
-
IProtein levels in MERRF muscle expressed relative to CTL muscle estimated by band densitometry normalized by α‐actin (OGDH, ALT2, GOT2) and by GAPDH (ALT1, GOT1).
Data information: In panels (B–D, and I), the dashed line indicates the Mean CTL value set at 1. In panels (B–G), data are presented as Mean ± SEM. Muscle: MERRF (n = 10), CTL (n = 15); Plasma: MERRF (n = 9), CTR (n = 25). In panel (I), data are presented as Mean ± SD. MERRF muscle (n = 4), CTL muscle (n = 4). Statistically significant differences between the two groups were estimated by unpaired two‐tailed Student's test. *P < 0.05 MERRF versus CTL.
Source data are available online for this figure.