
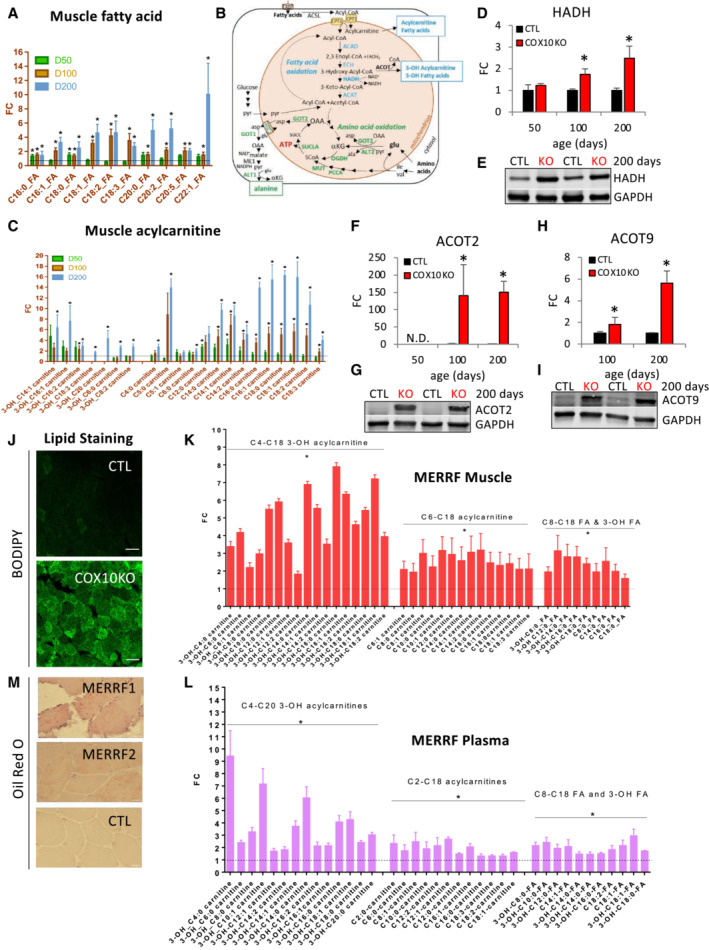
Figure 5. Lipid metabolism is altered in COX10 KO and MERRF muscle.
-
AMuscle levels of fatty acids by LC–MS analysis in COX10 KO expressed relative to same age CTL.
-
BSchematic representation of pathways of fatty acid (blue) and amino acid (green) oxidation in COX10 KO muscle. 3‐OH‐fatty acids, 3‐hydroxy fatty acid; 3‐OH‐acylcarnitine, 3‐hydroxy acylcarnitine; CoA, Coenzyme A; CPT1, carnitine acyltransferase 1; CPT2, carnitine acyltransferase 2; ACAD, acyl CoA dehydrogenase; ECH, enoyl‐CoA hydratase; HADH, 3‐hydroxyacyl‐CoA dehydrogenase; ACAT, 3‐ketoacyl‐CoA thiolase; ACOT, acyl‐CoA thioesterase.
-
CMuscle levels of acylcarnitine and 3‐OH carnitines by LC–MS analysis in COX10 KO expressed relative to same age CTL.
-
D–IAge‐dependent levels of HADH (D), ACOT2 (F), and ACOT9 (H), estimated by band densitometry normalized by GAPDH, in COX10 KO expressed relative to same age CTL set at 1. Representative western blot of muscle lysates from 200‐day‐old mice separated by denaturing SDS–PAGE and probed for HADH (E), ACOT2 (G), ACOT9 (I), and GAPDH (E, G, I).
-
JImage of calf muscle cross section stained for lipids with BODIPY (green) from 200‐day‐old COX10 KO and CTL muscle. Images are taken at 40X magnification; bar scale, 50 μm.
-
K, LLevels of acylcarnitine, 3‐OH acylcarnitine, fatty acid and 3‐OH fatty acid in MERRF muscle (K) and plasma (L) by LC–MS analysis, expressed relative to CTL.
-
MImage of deltoid muscle cross section stained for lipids with Oil red O (red) from two MERRF patients and one CTL. Images are taken at 20X magnification; bar scale, 50 μm.
Data information: In panels (A, C, K, and L), data by LC–MS analysis are presented as Mean ± SEM. In panels A and C, 50, 100, 200 days: COX10 KO (n = 6), CTL (n = 6). *P < 0.05 COX10 KO versus same age CTL. In panels (D, F, and H), data are presented as Mean ± SD. COX10 KO (n = 4), CTL (n = 4). *P < 0.05 COX10 KO versus same age CTL. In panels (K and L), muscle: MERRF (n = 10), CTL (n = 15); plasma: MERRF (n = 9), CTL (n = 25). *P < 0.05 MERRF versus CTL. Statistically significant differences between the two groups for all panels were estimated by unpaired two‐tailed Student's test.
Source data are available online for this figure.