
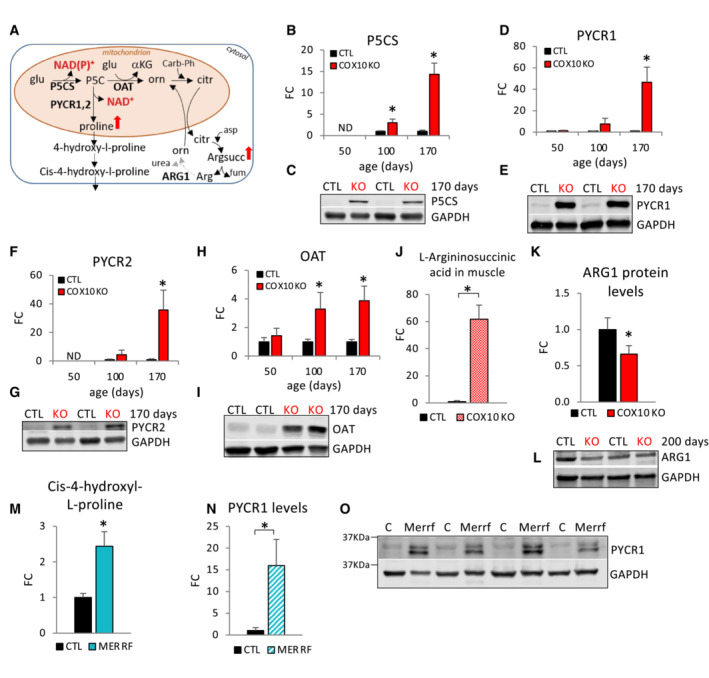
Figure 6. Alternative pathways of mitochondrial NADH oxidation and ammonia disposal are activated in OXPHOS defective muscle.
-
ASchematic representation of non‐anaplerotic pathways of glutamate utilization in MERRF and COX10 KO muscle. glu, glutamate; α‐KG, α‐ketoglutarate; P5C, pyrroline‐5‐carboxylate; orn, ornithine; citr, citrulline; carb‐Ph, carbamoyl‐phosphate; argsucc, L‐argininosuccinic acid; arg, arginine; P5CS, pyrroline‐5‐carboxylate synthase; OAT, ornithine aminotransferase; PYCR1, pyrroline‐5‐carboxylate reductase 1; PYCR2, pyrroline‐5‐carboxylate reductase 2; ARG1, arginase 1. Enzymes in bold indicate regulated steps detected by western blot analysis. The dashed arrow indicates downregulation of ARG1.
-
B–IAge‐dependent muscle protein levels of P5CS (B), PYCR1 (D), PYCR2 (F) OAT (H), estimated by band densitometry normalized by GAPDH, in COX10 KO expressed relative to same age CTL set at 1. Data are presented as Mean ± SD. *P < 0.05 COX10 KO versus same age CTL. Representative western blots of muscle lysates from 170‐day‐old mice separated by denaturing SDS–PAGE and probed for P5CS (C), PYCR1 (E), PYCR2 (G), OAT (I), and GAPDH (C, E, G, I).
-
JMuscle levels of L‐argininosuccinic acid by LC–MS analysis, in 200‐day‐old COX10 KO expressed relative to CTR set at 1.
-
KMuscle protein levels of ARG1, estimated by band densitometry normalized by GAPDH, in 200‐day‐old COX10 KO expressed relative to CTL set at 1.
-
LRepresentative western blot of muscle lysates from 200‐day‐old mice separated by denaturing SDS–PAGE and probed for ARG1 and GAPDH.
-
MMERRF plasma levels of 4‐hydroxyl‐L‐proline by LC–MS analysis, expressed relative to CTL value set at 1.
-
NPYCR1 protein levels, estimated by band densitometry normalized by GAPDH, in MERRF muscle expressed relative to CTL muscle.
-
OWestern blots of MERRF and CTL muscle lysates separated by denaturing SDS–PAGE and probed for PYCR1 and GAPDH.
Data information: In panels (B, D, F, H, and K), data are normalized to same age CTL set to 1. Data are presented as Mean ± SD. 50, 100, 200 days: COX10 KO (n = 4), CTL (n = 4). *P < 0.05 COX10 KO versus CTL. In panel (J), data are presented as Mean ± SEM. COX10KO (n = 6), CTL (n = 6). *P < 0.05 COX10 KO versus CTL. In panel (M), data are presented as Mean ± SEM. MERRF (n = 9), CTL (n = 25). In panel (N), data are presented as Mean ± SD. MERRF (n = 4), CTL (n = 4). *P < 0.05 MERRF versus CTL. Statistically significant differences between the two groups for all panels were estimated by unpaired two‐tailed Student's test.
Source data are available online for this figure.