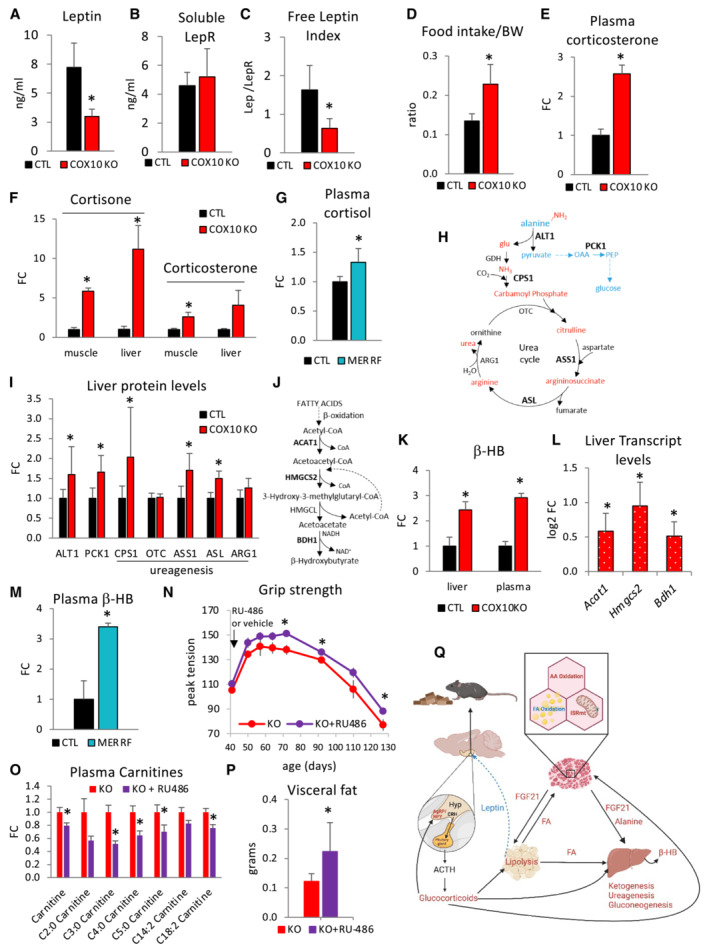
Figure 7. Leptin and glucocorticoids are altered in COX10 KO mice and MERRF patients.

-
A–CPlasma levels of Leptin (A), soluble leptin receptor (LepR) (B), and free leptin index (C) by ELISA, in 200‐dayold CTL and COX10 KO mice.
-
DDaily food intake normalized by body weight (BW) in 200‐day‐old CTL and COX10 KO mice.
-
E, FLevels of glucocorticoids by LC–MS/MS analysis in COX10 KO plasma (E), liver, and muscle (F), at 200 days of age, expressed relative to CTL value set at 1.
-
GLevels of glucocorticoids in MERRF plasma by LC–MS analysis, expressed relative to CTL value set at 1.
-
HSchematic representation of hepatic alanine disposal through pathways of gluconeogenesis (blue) and ureagenesis (red). ALT1, alanine aminotransferase 1; PCK1, phosphoenolpyruvate carboxykinase 1; CPS1, carbamoyl‐phosphate synthase 1; OTC, ornithine transcarbamylase; ASS1, argininosuccinate synthase 1; ASL, argininosuccinate lyase; ARG1, arginase 1. Enzymes in bold indicate upregulated steps detected by western blot analysis.
-
ILiver protein levels of ALT1, PCK1, CPS1, OTC, ASS1, ASL, and ARG1, estimated by band densitometry normalized by β‐actin, in 200‐day‐old COX10 KO expressed relative to same age CTL set at 1.
-
JSchematic pathway of ketogenesis in liver: ACAT1, acetyl‐CoA acetyltransferase; HMGCS2, HMG‐CoA synthase; HMGCL, HMG‐CoA lyase; BDH1, β‐hydroxybutyrate dehydrogenase 1.
-
KLiver and plasma levels of β‐hydroxybutyrate (β‐HB) by LC–MS analysis, in 200 days old COX10 KO expressed relative to CTL set at 1.
-
LLiver transcript levels of Acat1, Hmgcs2, and Bdh1 genes in 200‐day‐old COX10 KO expressed as log2 fold change relative to CTL. P.adj < 0.05 COX10 KO versus CTL. COX10 KO (n = 6), CTL (n = 6). Two‐tail unpaired Student's t‐tests were used for sample comparisons. Corrected P values were calculated based on the Benjamini–Hochberg method to adjust for multiple comparisons.
-
MPlasma levels of β‐HB by LC–MS analysis in MERRF expressed relative to CTL set at 1.
-
NAge‐dependent grip strength of COX10 KO mice treated with RU‐486 and vehicle. The black arrow indicates the beginning of the treatment at 43 days.
-
OPlasma levels of acylcarnitine in COX10 KO mice treated with RU‐486 or vehicle at 100 days of age, by LC–MS analysis, expressed relative to KO.
-
PVisceral fat deposits of COX10 KO mice treated with RU‐486 and vehicle at 100 days of age.
-
QSchematics of the proposed inter‐organ hormonal signaling mechanisms leading to systemic metabolic responses in mitochondrial myopathy. FA, fatty acids; AA, amino acids; β‐HB, β‐hydroxybutyrate; CRH, Corticotrophin‐releasing hormone; ACTH, Adrenocorticotropic hormone; AgRP, Agouti‐related peptide; NPY, neuropeptide Y; Hyp, Hypothalamus. Increased metabolites, hormones, and pathways are labeled in red; decreased hormone and pathway are labeled in blue.
Data information: In panels (A–C), data are presented as Mean ± SD. COX10 KO (n = 5), CTL (n = 5). *P < 0.05 COX10 KO versus CTL. In panel (D), data are presented as Mean ± SD. COX10 KO (n = 9), CTL (n = 10). In panels (E, F), data measured in duplicate are presented as Mean ± SEM. Plasma: COX10 KO (n = 3), CTL (n = 3). Liver: COX10 KO (n = 3), CTL (n = 3). Muscle: COX10 KO (n = 3), CTL (n = 3). *P < 0.05 COX10 KO versus CTL. In panels (G and M), data are presented as Mean ± SEM. MERRF (n = 9), CTL (n = 25). In panel (I), data are presented as Mean ± SD. ALT1, PCK1, and CPS1: COX10 KO (n = 8), CTL (n = 8). OTC, ASS1, ASL, and ARG1: COX10 KO (n = 4), CTL (n = 4).*P < 0.05 COX10 KO versus CTL. In panel (K), data are presented as Mean ± SEM. Liver: COX10 KO (n = 3), CTL (n = 3). Plasma: COX10 KO (n = 6), CTL (n = 6) *P < 0.05 COX10 KO versus CTL. In panel (L), data are presented as Mean ± SE. COX10 KO (n = 6), CTL (n = 6). In panels (N, O), data are presented as Mean ± SEM. Panel (N): KO + RU486 (n = 6), KO (n = 4). Panel O: KO + RU486 (n = 6), KO (n = 6). In panel (P), data are presented as Mean ± SD. KO + RU486 (n = 6), KO (n = 6). *P < 0.05 KO + RU486 versus KO. Statistically significant differences between the two groups for all panels were estimated by unpaired two‐tailed Student's test.
Source data are available online for this figure.
