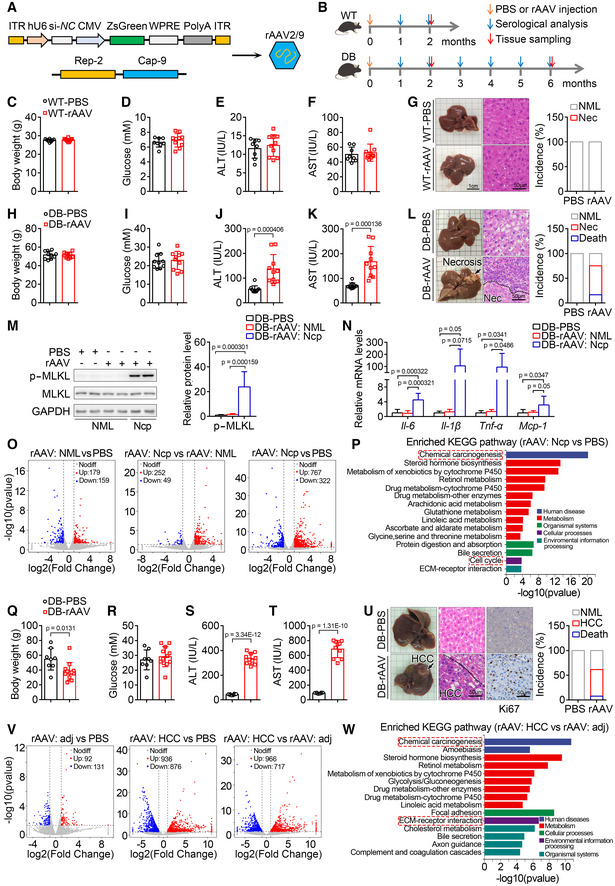
Figure 1. Tail vein injection of rAAV induces liver injury, hepatic necroptosis, and carcinoma in db/db but not wild‐type mice.

-
A, BSchematic of rAAV serotype 2/9 (rAAV2/9) package for expressing si‐NC and ZsGreen (A) and the experimental design for the effect of rAAV injection on liver function and the potential development of liver cancer (B). ITR, AAV2 ITR. Except indicated, rAAV2/9 expressing si‐NC and ZsGreen were used.
-
C–FTwo months after a single tail vein injection of rAAV, wild‐type mice showed similar body weight (C), blood glucose levels (D), serum alanine aminotransferase (ALT) (E) and aspartate aminotransferase (AST) activities (F) with the mice injected with PBS. n = 8–10 for each group.
-
GLiver images, H&E staining of liver sections and the incidence of hepatic necrosis (Nec) for mice in (C). NML, Normal.
-
H, ITwo months after a single injection of rAAV, db/db mice showed similar body weight (H) and blood glucose levels (I) with the mice injected with PBS. n = 10 for each group.
-
J, KSerum ALT (J) and AST (K) of mice in (H).
-
LLiver images, H&E staining of liver sections for mice in (H) and the incidence of death and hepatic necrosis of db/db mice after a single injection of PBS or rAAV for 2 months. n = 10–12 for each group.
-
MThe hepatic p‐MLKL protein level in normal and necrotic area from mice injected with PBS or rAAV in (H). Ncp, Necroptosis. n = 7–8 biological replicates.
-
NThe hepatic mRNA levels of Il‐6, Il‐1β, Tnf‐α and Mcp‐1 involved in necroptosis at normal or necroptotic area from mice injected with PBS or rAAV in (H). n = 7–8 biological replicates.
-
OScatter plots comparing the differentially expressed hepatic genes of mice in (H).
-
PThe top 15 significantly enriched KEGG pathways of the differentially expressed genes in (O).
-
Q, RSix months after a single injection of rAAV, db/db mice showed decreased body weight (Q) and similar blood glucose levels (R) compared to the mice injected with PBS. n = 8–12.
-
S, TSerum ALT (S) and AST (T) activities of mice in (Q). n = 8–10.
-
ULiver images, H&E staining, and ki67 immunohistochemistry of liver sections for mice in (Q) and the incidence of death and HCC of db/db mice after a single injection of PBS or rAAV for 6 months. n = 8–13.
-
VScatter plots comparing the differentially expressed hepatic genes of mice in (Q). adj, adjacent.
-
WThe top 15 significantly enriched KEGG pathways of the differentially expressed genes in (V).
Data information: In (C–F, H–K, M, N, Q–T), data are presented as mean ± SD. Student's t‐test.
Source data are available online for this figure.
