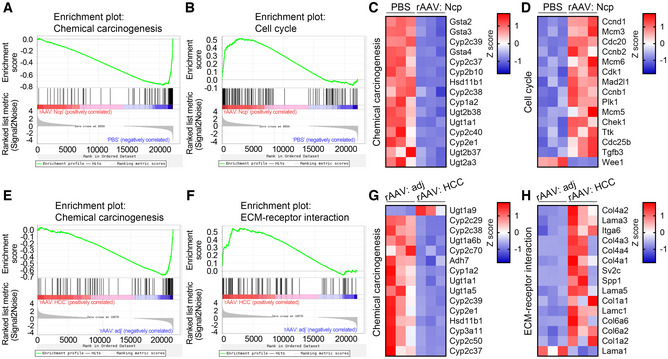
Figure EV3. GSEA analysis and heatmaps of the top 15 differentially expressed genes in the indicated enriched KEGG pathways.

-
A, BGSEA analysis of the indicated enriched KEGG pathways of the differentially expressed genes in normal or necroptotic area from the liver of mice after a single injection of PBS or rAAV for 2 months. Ncp, necroptosis.
-
C, DHeatmaps of the top 15 differentially expressed genes ranked by adjusted P value in the indicated KEGG pathways in (A) and (B).
-
E, FGSEA analysis of the indicated enriched KEGG pathways of the differentially expressed genes in adjacent or HCC area from the liver of mice after a single injection of rAAV for 6 months. adj, adjacent.
-
G, HHeatmaps of the top 15 differentially expressed genes ranked by adjusted P value in the indicated KEGG pathways in (E) and (F).
