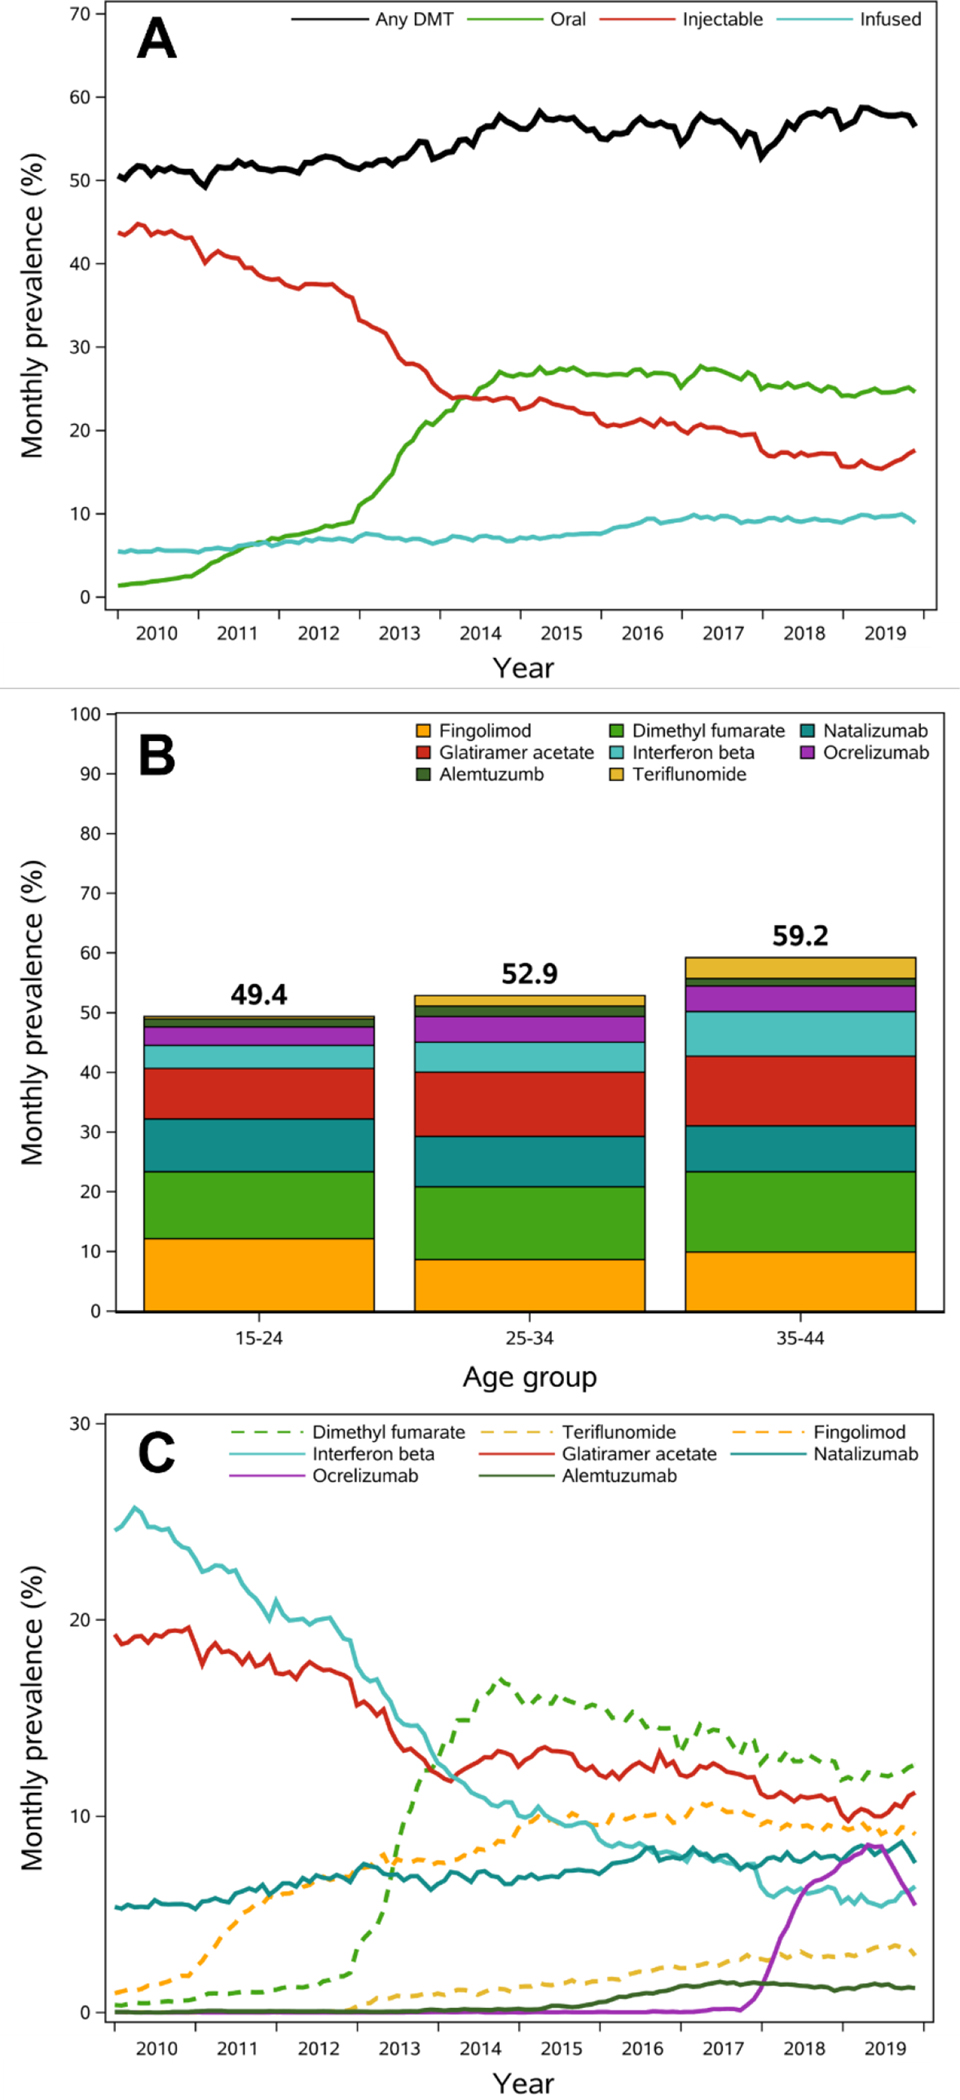
Figure 1. Prevalence of disease-modifying therapies from 2010–2019.

Abbreviations: DMT=disease modifying therapy.
A. Age- and region-standardized monthly prevalence of DMT use over time, overall and by route of administration.
B. Average monthly prevalence of DMT use during the period from 2017–2019 by age category. Daclizumab and mitoxantrone are not presented since prevalence was low across the entire study follow-up.
C. Age- and region-standardized monthly prevalence of DMT use over time, by generic name. Dashed lines represent oral DMTs, and solid lines represent infused or injected DMTs. Daclizumab and mitoxantrone are not presented since prevalence was low across the entire study follow-up (max monthly prevalence mitoxantrone: 0.1% in May 2010; daclizumab: 0.2% in September 2017).
