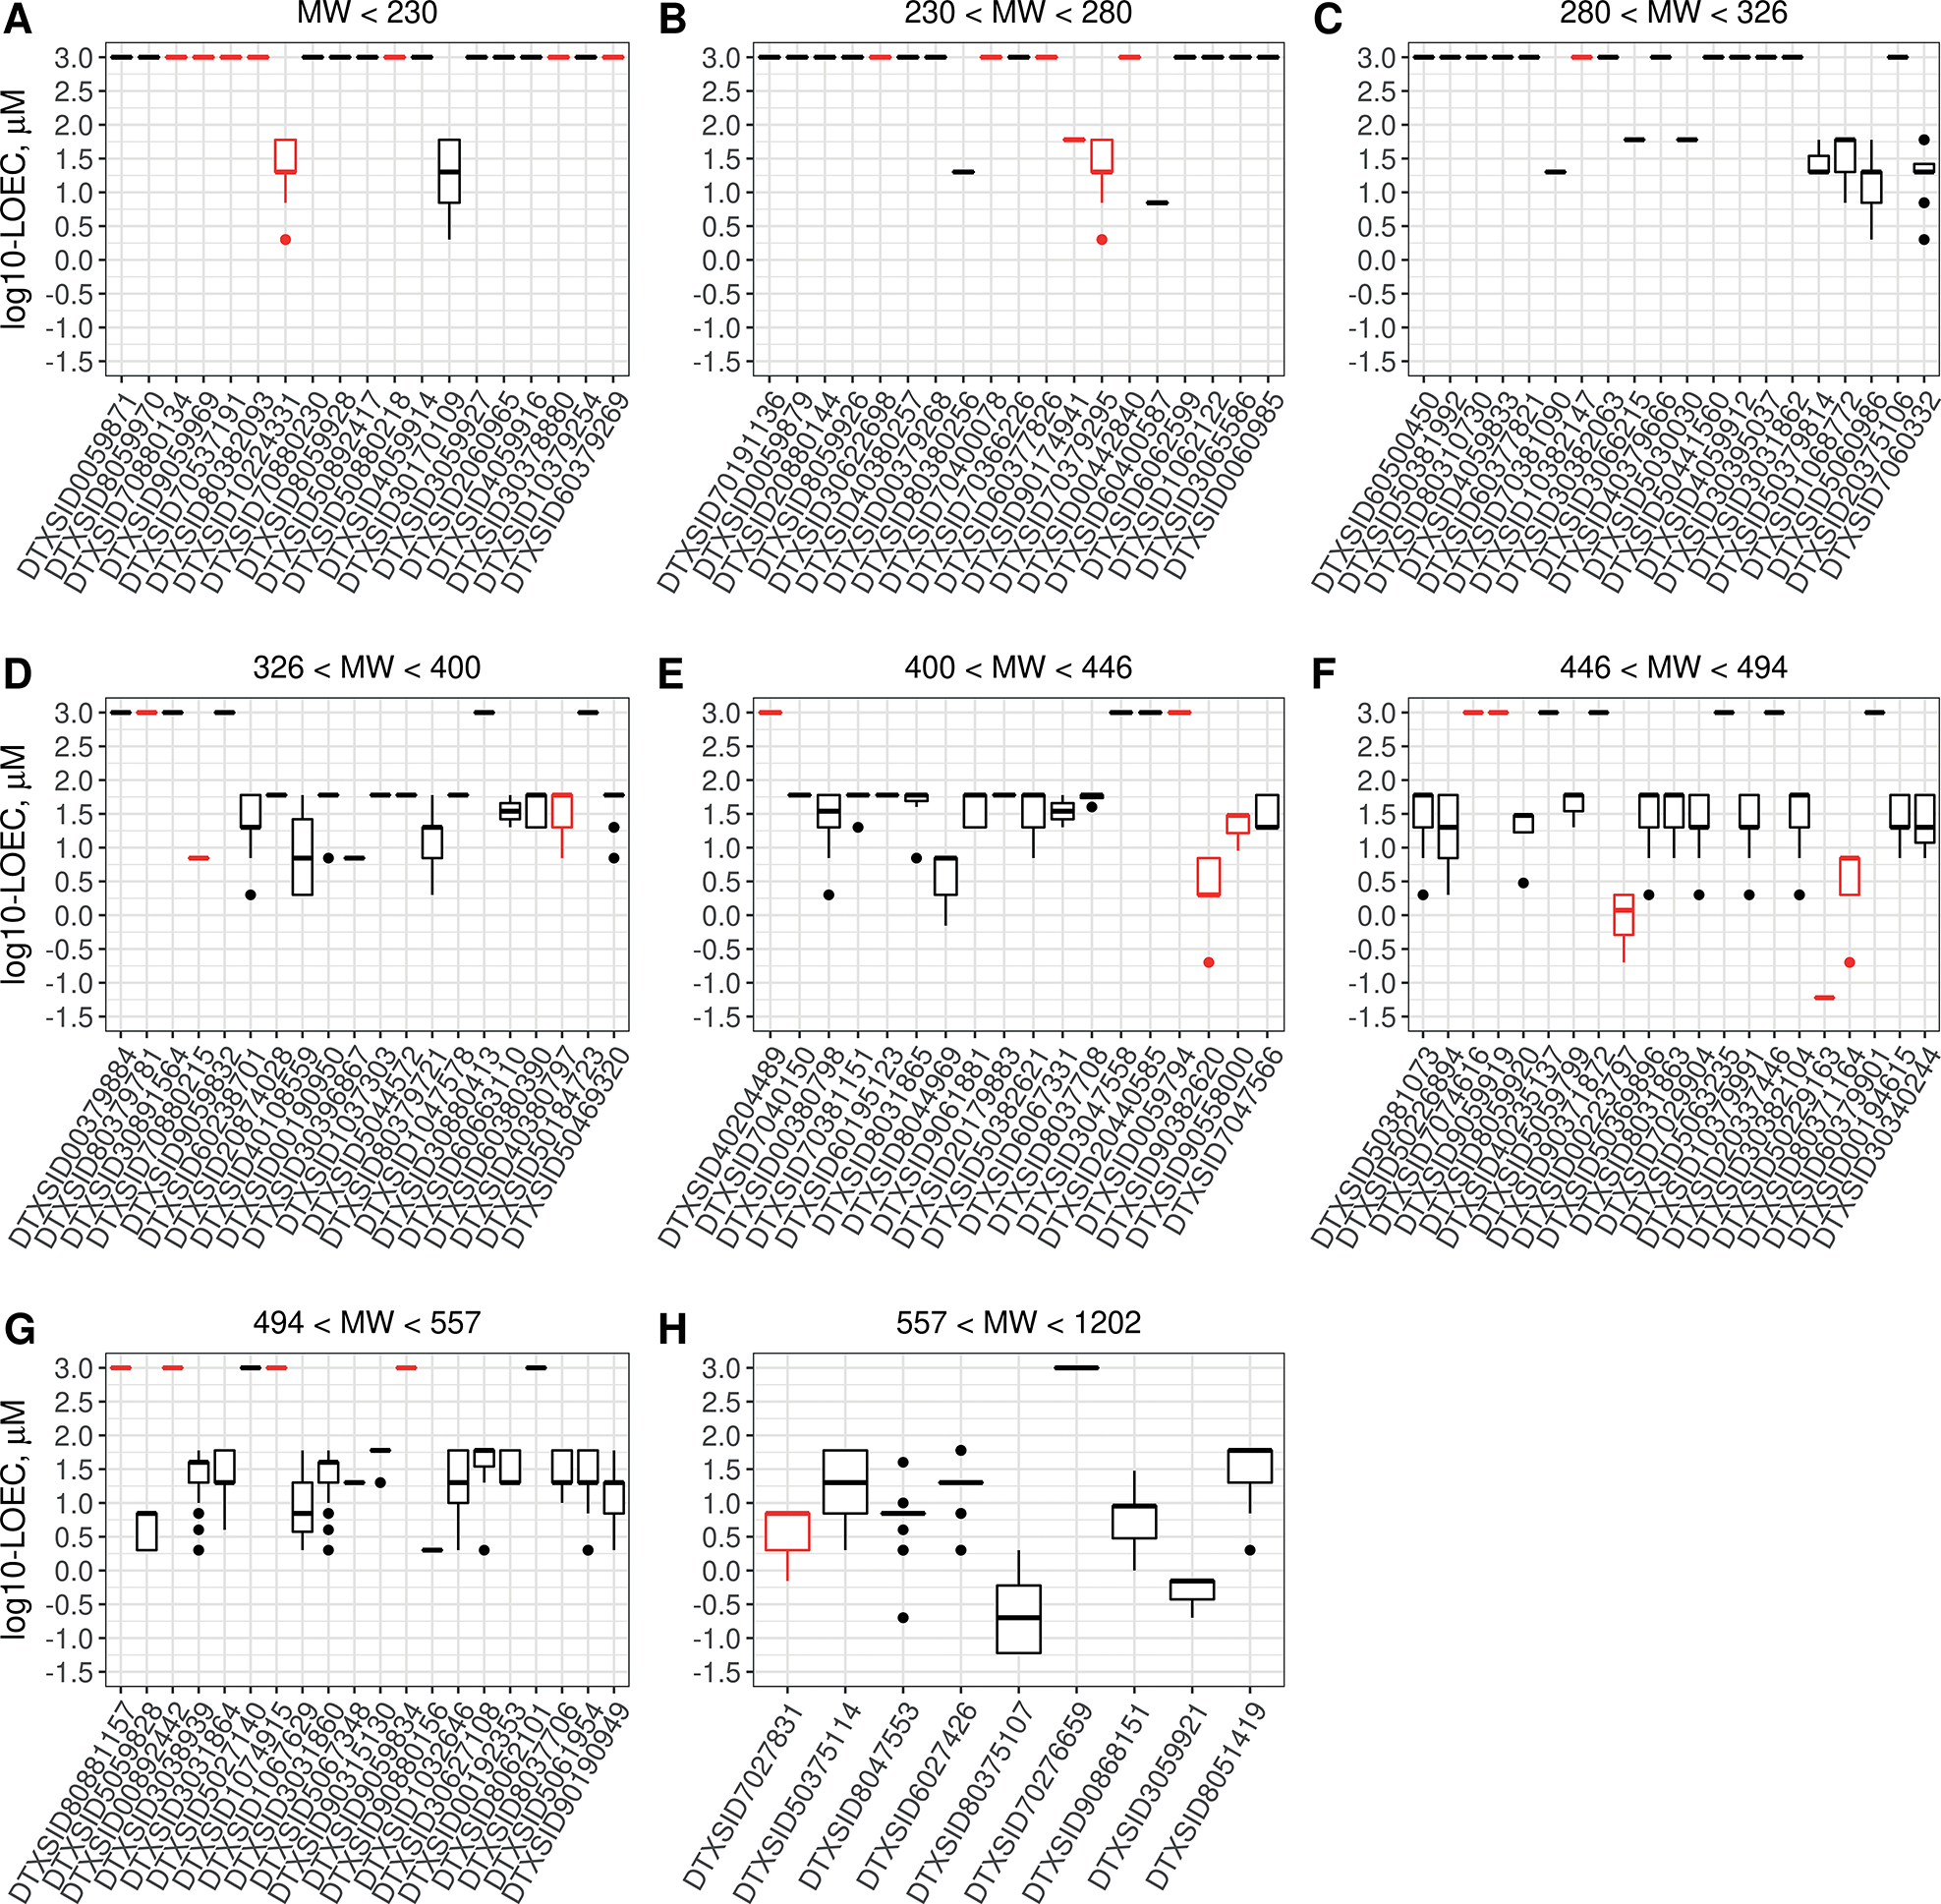
Fig. 2: Potency of PFAS in BioMAP.

Boxplots indicate the median and interquartile range of lowest effect concentrations by PFAS for all endpoints, with the PFAS grouped by increasing molecular weight as indicated by the title label for each subplot, A-H. Chemicals are identified by DTXSID, and chemical name and analytical chemistry analysis results are available in Table S23. Lines at 3.0 on the y-axis indicate PFAS that were negative in the BioMAP panel. Black = passing analytical QC; red = analytical QC denoted as failure.
