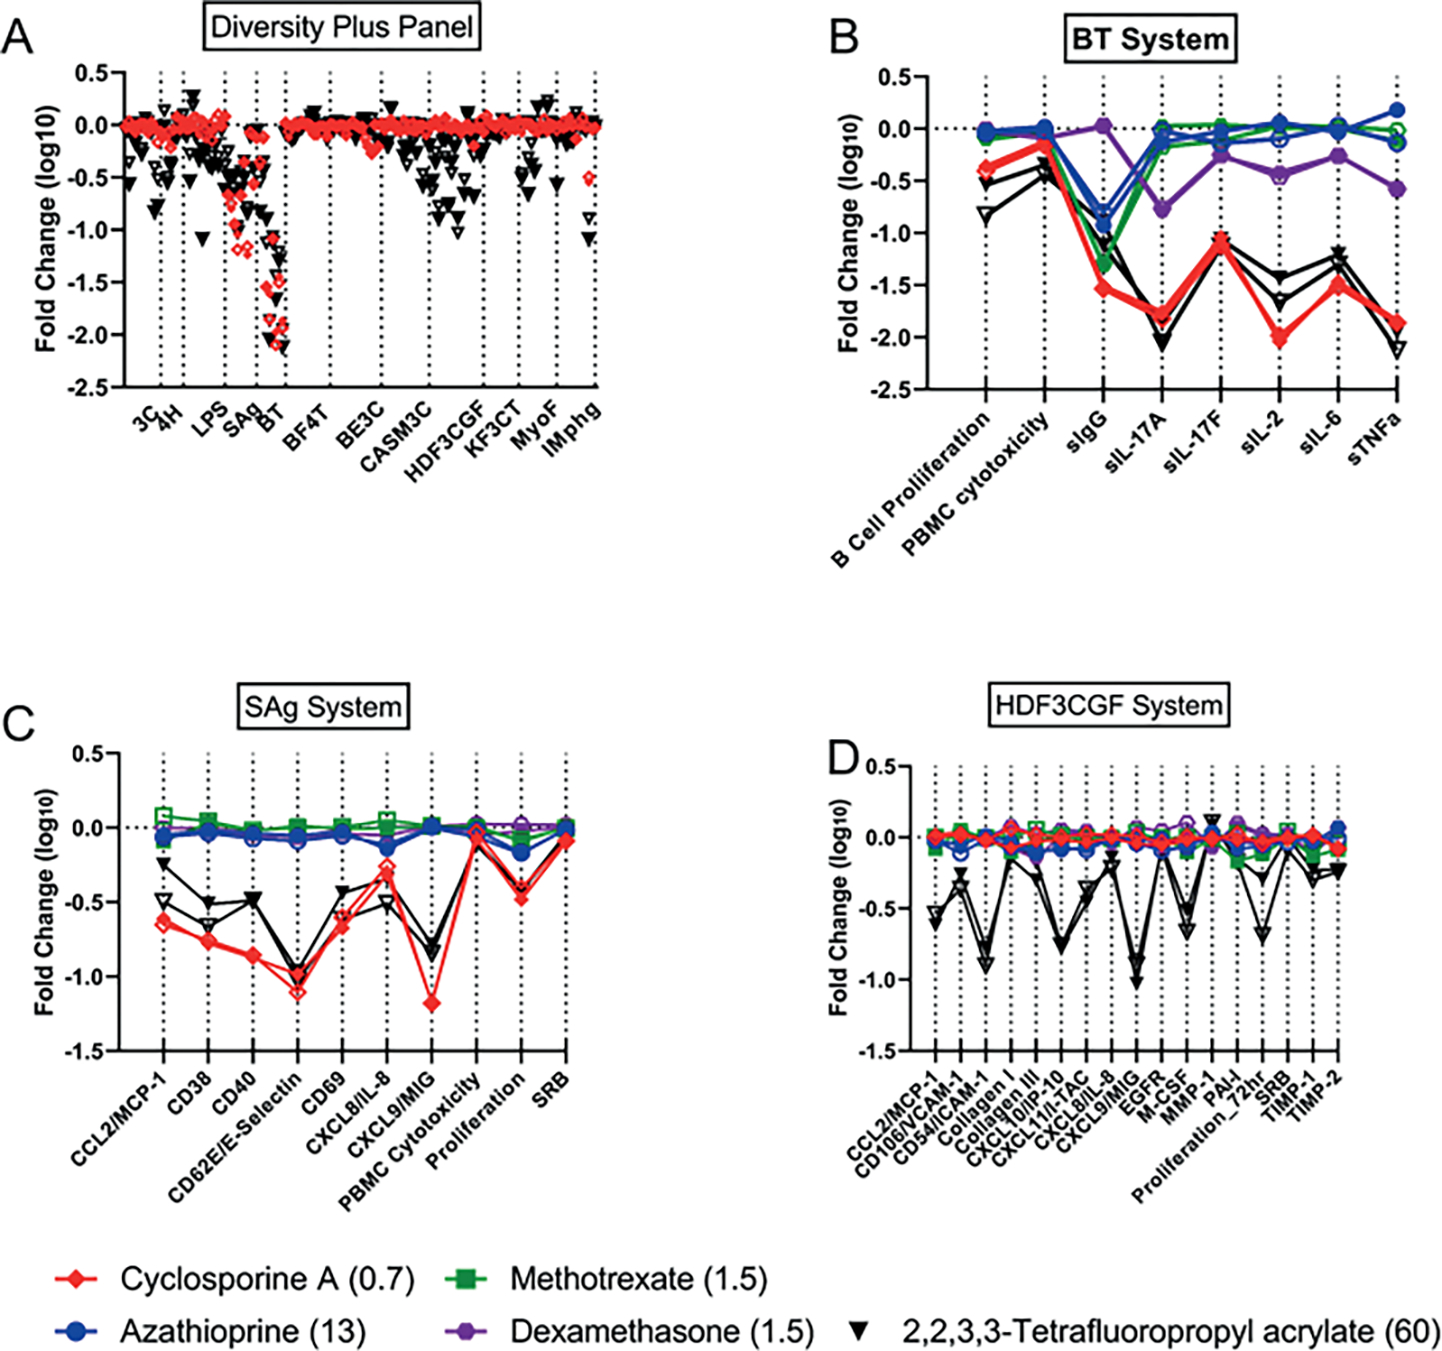
Fig. 4: Comparison of cyclosporine A with 2,2,3,3-tetrafluoropropyl acrylate.

The Y-axes on 4A-D all represent the log10-fold change observed with a given chemical. Responses across all Diversity Plus panel endpoints for 2,2,3,3-tetrafluoropropyl acrylate (60 mM) (black) and cyclosporine A (0.67 mM) (red) are shown in (A) with the two replicates indicated by open or closed symbols. Responses for the individual cell systems BT (B), SAg (C), and HDF3CGF (D) show more detail and also include the reference immunosuppressants azathioprine (13 mM) (blue), methotrexate (1.5 mM) (green), and dexamethasone (1.5 mM) (purple). The X-axis labels in (B), (C), and (D) represent measurements made within those systems such as cytokines secreted or cellular proliferation.
