
Fig. 7: Comparison of response profiles in the 12 assay systems of the BioMAP Diversity Plus panel for PFAS with high Pearson’s correlations with reference pharmacological compounds from the BioMAP reference database.
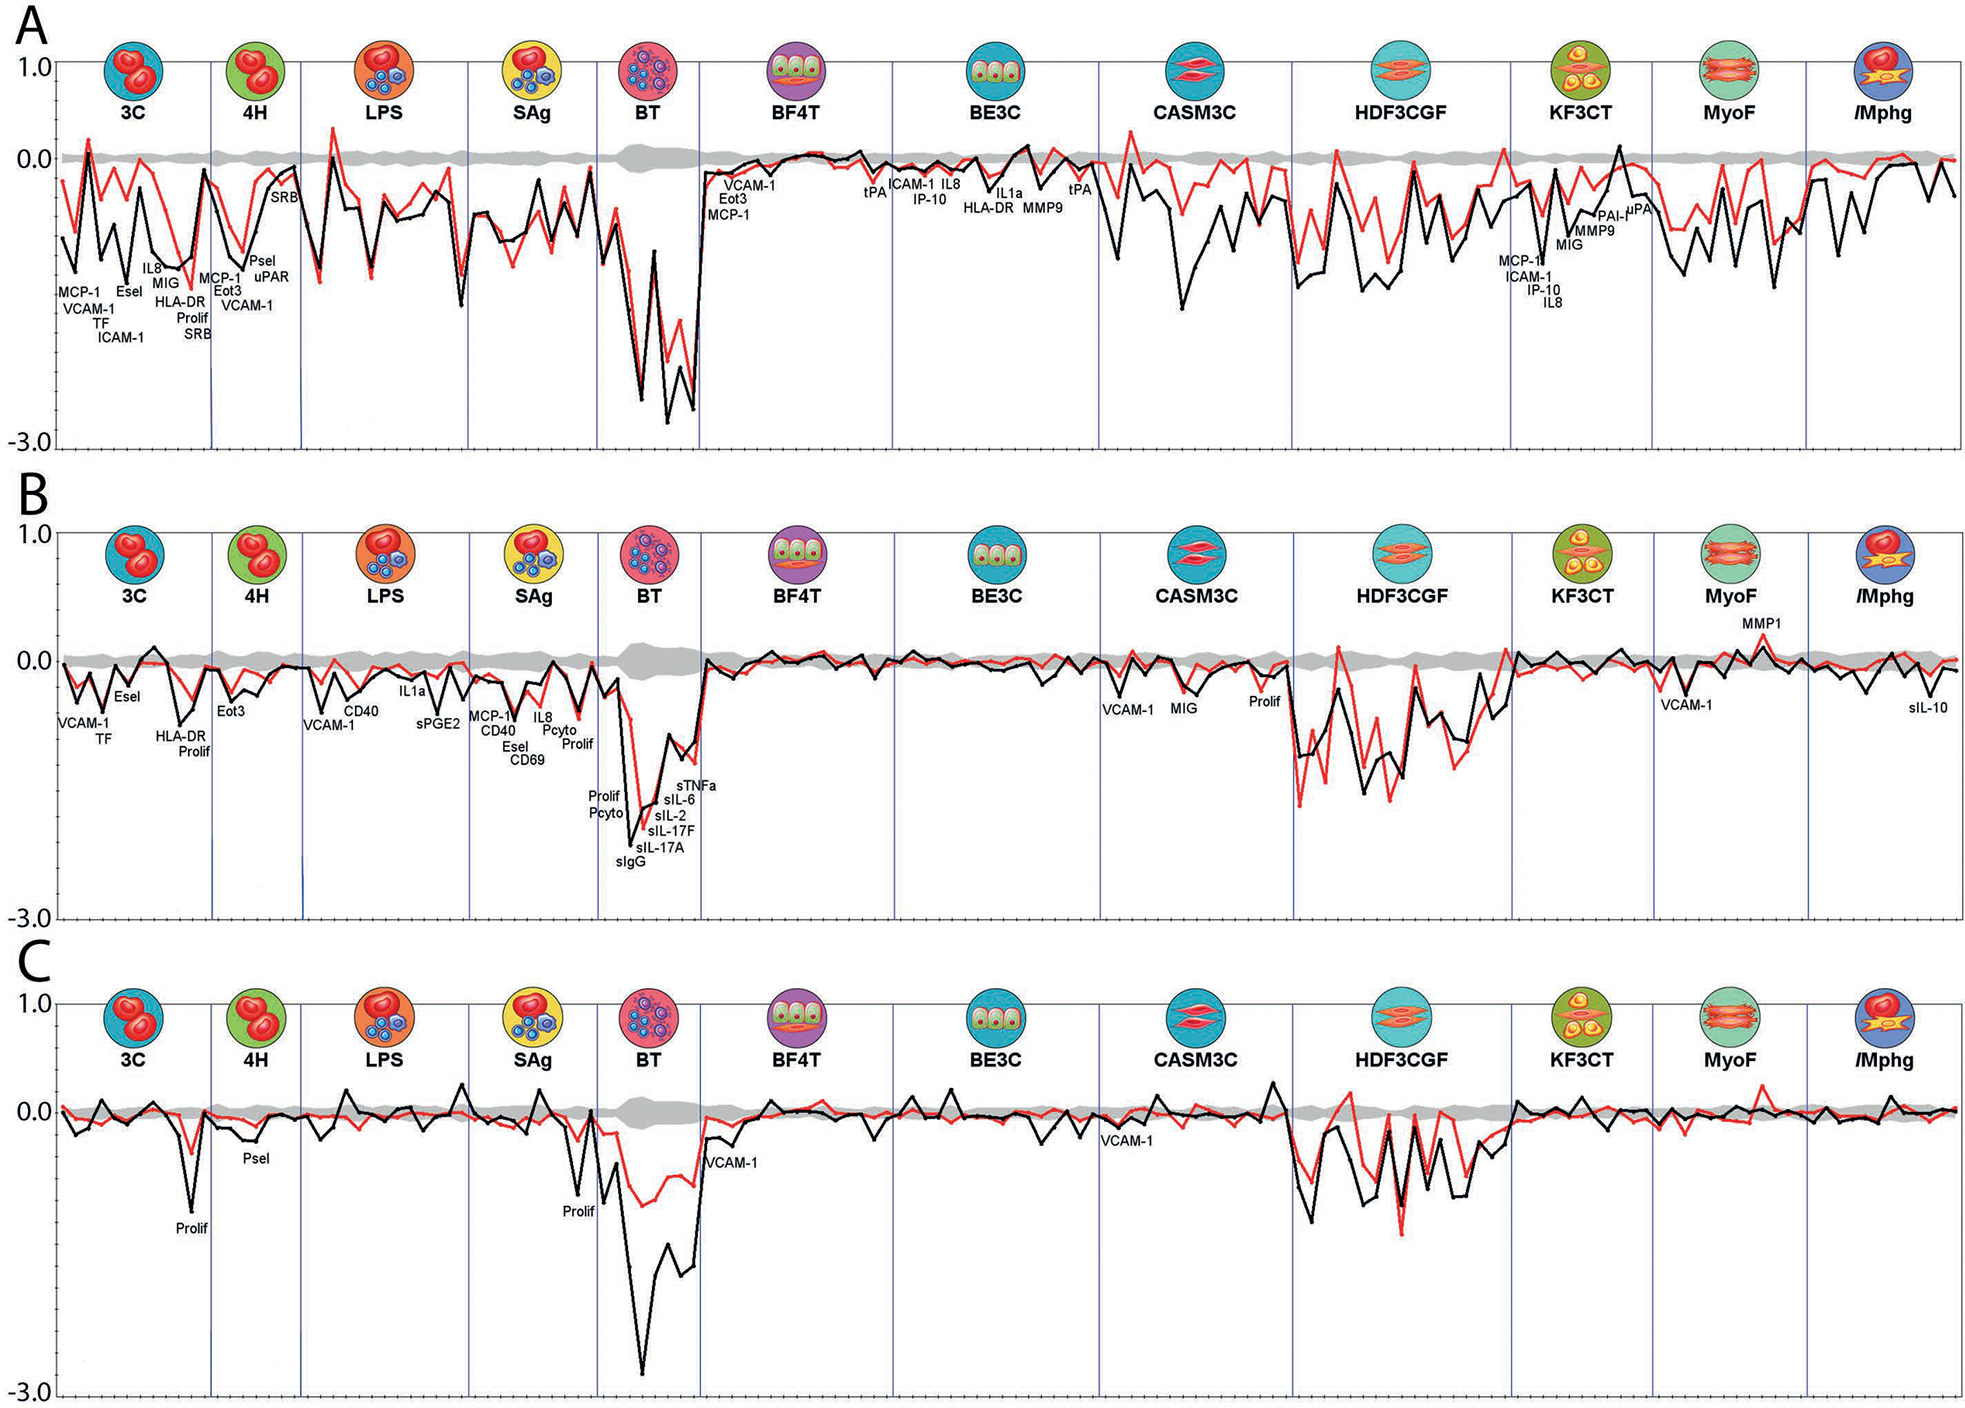
Responses are shown as log10 fold-change over solvent control. Statistically significant responses extend beyond the gray shaded region.
(A) 1H,1H,5H,5H-Perfluoro-1,5-pentanediol diacrylate (30 mM, red line) and the ubiquitin ligase inhibitor Ro 106–9920 (10 mM, black line).
(B) 1H,1H,5H,5H-Perfluoro-1,5-pentanediol diacrylate (6.7 mM, red line) and the anti-angiogenic drug TNP-40 (10 mM, black line).
(C) 1H,1H,6H,6H-Perfluorohexane-1,6-diol diacrylate (6.7 mM, red line) and the antibiotic auranofin (370 nM, black line).