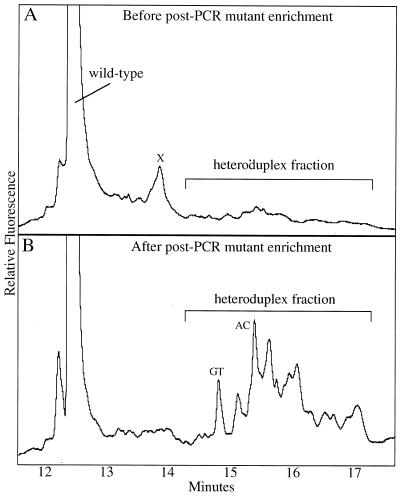
Figure 2.
Post-PCR enrichment of mutant sequences by CDCE coupled with PCR. Depicted are CDCE separations of PCR products derived from the MNNG-treated MT1 cells. The horizontal axis represents the time when the peak reaches the detector after the beginning of the run. The vertical axis represents the relative intensity of fluorescence, which is proportional to the molecular number. The wild-type peak in both electropherograms is shown at 1/10 of its full height. (A) The mutant-enriched fraction from wide bore CE separations was subjected to 40 cycles of high fidelity PCR. The PCR products were separated by CDCE and the heteroduplex fraction was collected. X marks a PCR by-product. (B) The collected heteroduplex fraction was subjected to 38 cycles of PCR and separated by CDCE. GT and AC mark the two heteroduplexes derived from the internal standard introduced at an initial mutant fraction of 10–5. The heteroduplex fraction was collected and amplified to further enrich the mutants.

