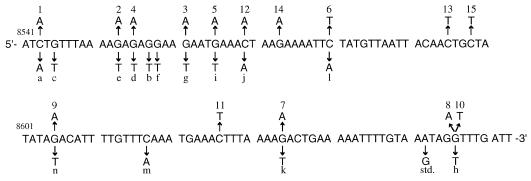
Figure 4.
Distribution of base substitutions in the APC gene target sequence (APC cDNA bp 8543–8663) in MNNG-treated and untreated MT1 cells. Mutants from the treated cells are shown above the wild-type sequence, while those from the untreated are below the sequence. Mutant labels correspond to those in Figure 3. The base substitution of the internal standard (std.) is also indicated.

