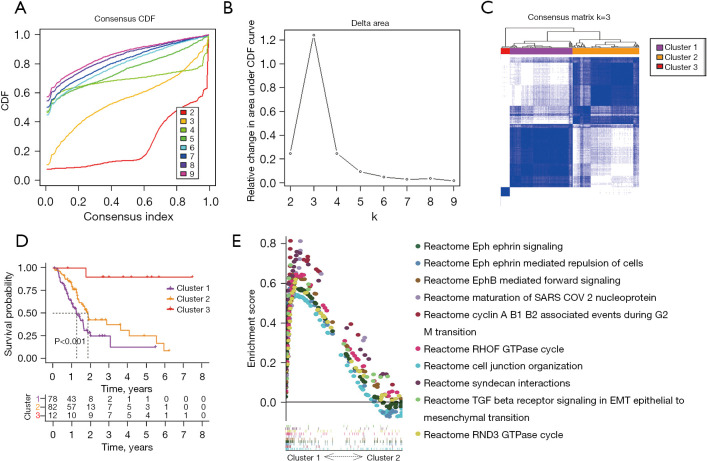
Figure 1.
Subtype identification based on HRGs in PCA. (A) CDF curve and (B) delta area in TCGA cohort; (C) heatmap representing the consensus matrix; (D) KM curves showing OS of 3 subtypes; (E) pathways enriched in cluster 1 in comparison with cluster 2. HRGs, hypoxia-related genes; PCA, pancreatic cancer; CDF, cumulative distribution function; TCGA, The Cancer Genome Atlas; KM, Kaplan–Meier; OS, overall survival.

