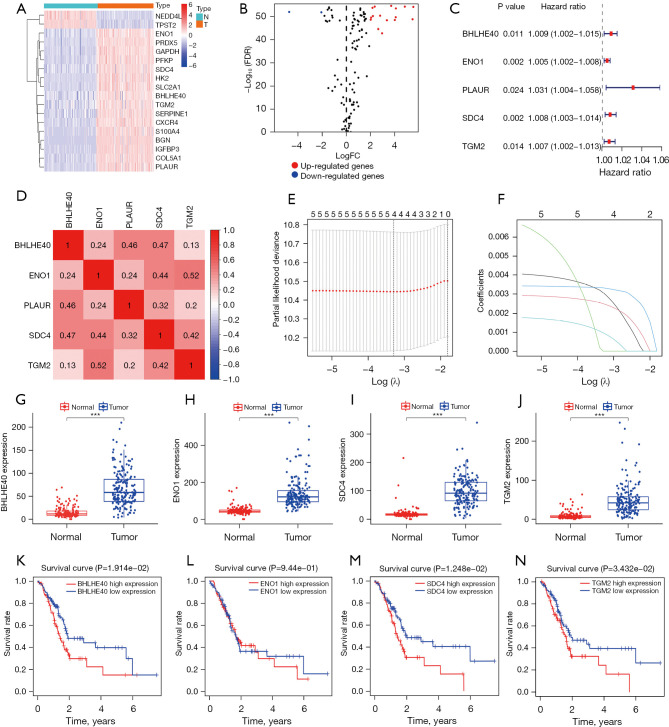
Figure 2.
Screening of key HRGs to construct a PCA prognostic model. (A) Heatmap and (B) volcano map of 18 differentially expressed HRGs. (C) Five HRGs closely related to OS in PCA by univariate Cox regression. (D) Spearman correlation analysis of 5 HRGs in the TCGA database. (E) Selection of the optimal genes used to construct the final prediction model by LASSO regression analysis. Ten-fold cross-validation for tuning parameter selection. (F) LASSO coefficient profiles of the key genes. Each colored line represents the variation trajectory of each gene coefficient; (G-J) comparison of the expression levels of BHLHE40, ENO1, SDC4, and TGM2 between PCA tissue and normal pancreatic tissue in the training set. (K-N) KM survival curves for of BHLHE40, ENO1, SDC4, and TGM2 in the training set. ***, P<0.001. HRGs, hypoxia-related genes; PCA, pancreatic cancer; FC, fold-change; FDR, false discovery rate; OS, overall survival; TCGA, The Cancer Genome Atlas; LASSO, least absolute shrinkage and selection operator; KM, Kaplan–Meier.

