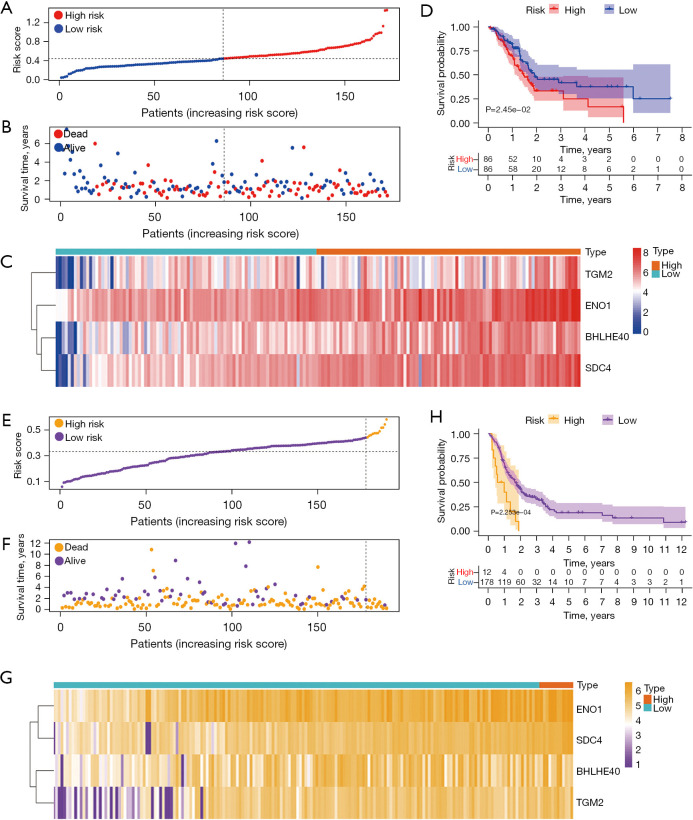
Figure 3.
Construction and validation of a hypoxia-related prognostic model. (A) Sorting patients according to risk score in the TCGA training set; (B) association between survival time and risk score in the TCGA training set; (C) heatmaps showing 4 HRGs expression profiles in high-risk and low-risk groups in the TCGA training set; (D) KM curves of patients in the high-risk and low-risk groups of TCGA training set; (E) sorting patients according to risk score in the GEO validation set; (F) association between survival time and risk score in the GEO validation set; (G) heatmaps showing 4 HRGs expression profiles in high-risk and low-risk groups in the GEO validation set; (H) KM curves of patients in the high-risk and low-risk groups of the GEO validation set. TCGA, The Cancer Genome Atlas; HRGs, hypoxia-related genes; KM, Kaplan–Meier; GEO, Gene Expression Omnibus.

