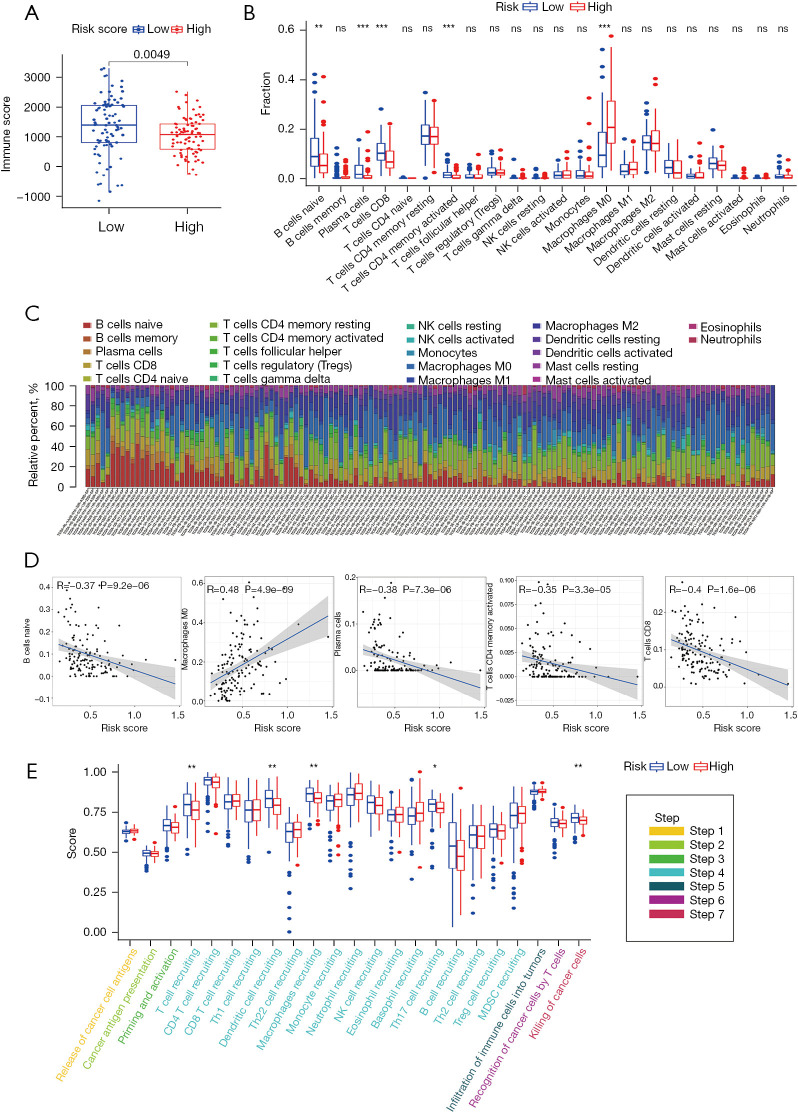
Figure 5.
Analysis of the TME in the hypoxia-related prognostic model. (A) ImmuneScore between the low-risk group and the high-risk group in the TCGA cohort; (B) the landscape of immune cell infiltration of PCA patients in the TCGA cohort; (C) The proportion of infiltrating immune cells in the high- and low-risk groups in the TCGA cohort; (D) Spearman correlation analyses between risk scores in the TCGA cohort and the infiltrations of five kinds of immune cells, including naïve B cells, M0 macrophages, plasma cells, activated CD4+ memory T cells and CD8+ T cells; (E) differences in the various steps of the cancer-immunity cycle between the high-risk and low-risk groups in the TCGA cohort. ns, not significant; *, P<0.05; **, P<0.01; ***, P<0.001. PCA, pancreatic cancer; TCGA, The Cancer Genome Atlas; TME, tumor microenvironment.

