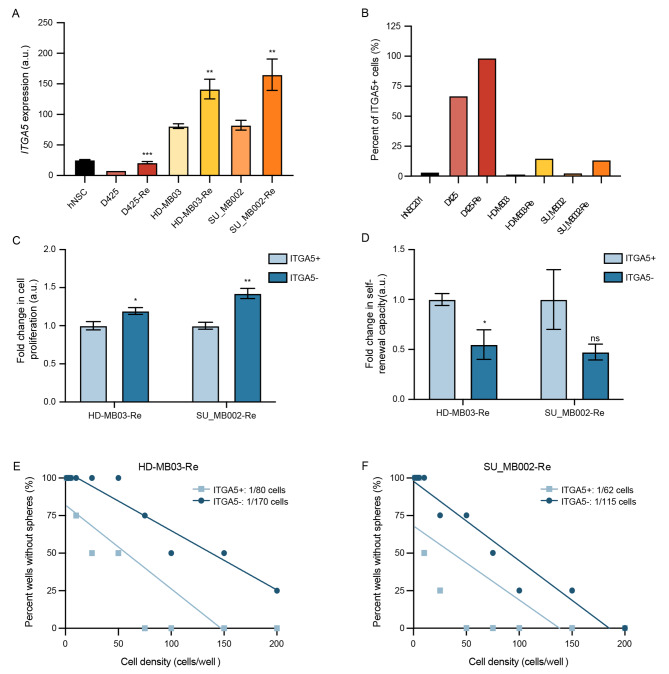
Fig. 2.
Increased ITGA5 expression correlates with aggressive phenotype of Group 3 MB. (A)ITGA5 mRNA levels and (B) flow cytometric evaluation of cell surface levels of ITGA5 in human neural stem cells (hNSCs), as well as primary and matched-recurrent MB lines. Changes in (C) proliferation and (D) self-renewal capacity of recurrent Group 3 MB cells with (ITGA5+) and without (ITGA5-) ITGA5 presenting on the cell surface. Fraction of self-renewing cells in (E) HD-MB03-Re and (F) SU_MB002-Re post flow based on ITGA5 presentation on the cell surface. Bars represent mean of at least three technical replicates, with the exception of Fig. 2B with only one value. Bars represent mean of at least three technical replicates. *p ≤ 0.05, **p ≤ 0.001, ***p ≤ 0.0001, ****p ≤ 0.00001; unpaired t-test or one-way ANOVA with Sidak’s method for multiple comparisons

