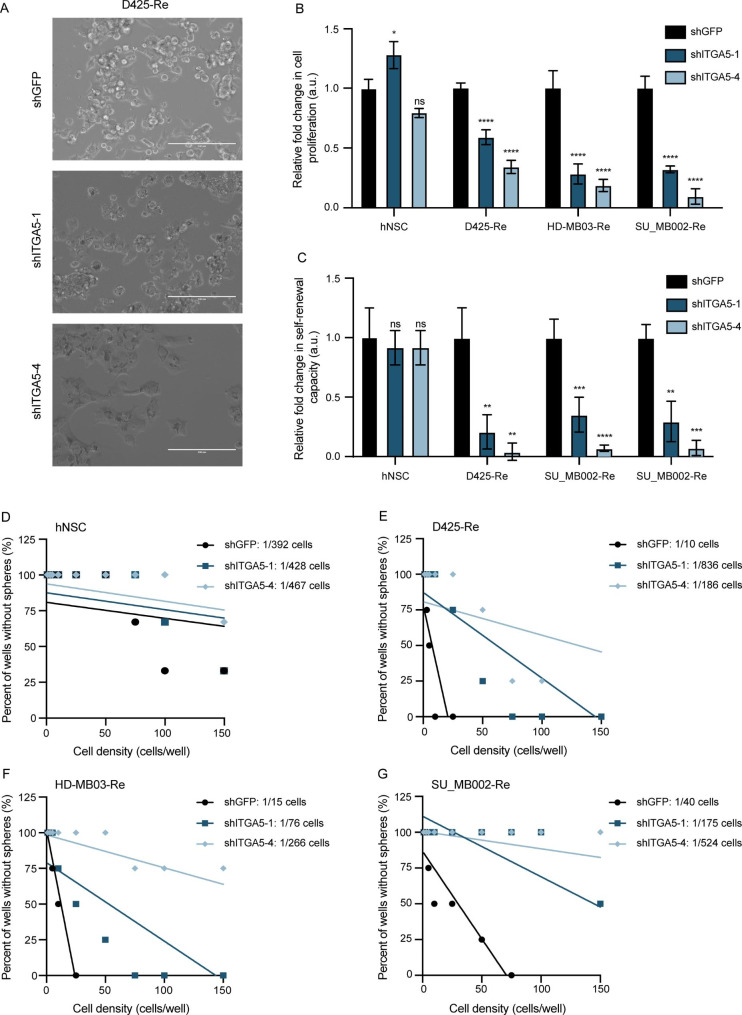
Fig. 3.
In vitro effects of ITGA5 KD in MB cell lines. (A) Microscopic images demonstrating phenotypic changes post lentivector mediated KD of ITGA5 in representative recurrent Group 3 MB. Changes in (B) proliferation, (C) self-renewal, and (D-G) frequency of self-renewing cells of ITGA5 KD, compared to control lentivector in hNSC and recurrent Group 3 MB cell cultures. Bars represent mean of at least three technical replicates. Control samples (shGFP) normalized to 1.0. Bars represent mean of at least three technical replicates. *p ≤ 0.05, **p ≤ 0.001, ***p ≤ 0.0001, ****p ≤ 0.00001; unpaired t-test or one-way ANOVA with Sidak’s method for multiple comparisons

