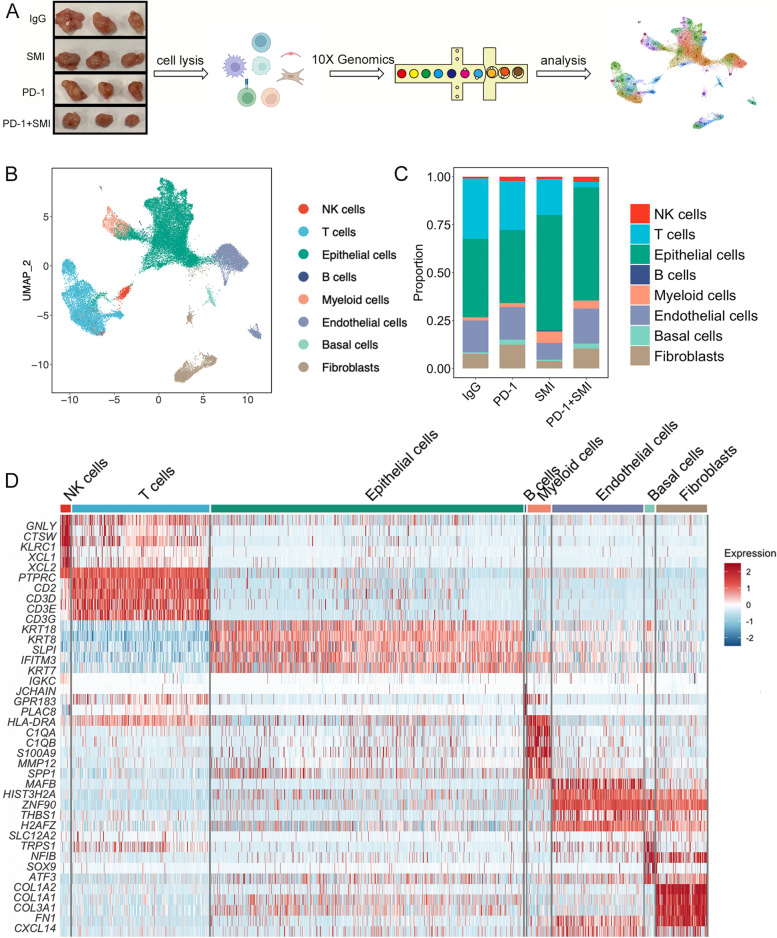
Fig. 3.
Single-cell transcriptome profiles of four treatments in the humanized mouse model. (A) The overview of single-cell RNA sequencing (scRNA-seq) experiment. Tumor tissues from three representative mice in each group were collected. IgG: immunoglobulin G isotype control; PD-1: PD-1 immune-checkpoint blockade antibody; SMI: SMI monotherapy; PD-1+SMI: combination of anti-PD-1 and SMI. (B) Uniform manifold approximation and projection (UMAP) showing eight cell types for 38,010 cells. (C) Proportion of eight cell types in the IgG, PD-1, SMI, and PD-1+SMI. (D) Heatmap showing differentially expressed genes (DEGs) for eight cell types

