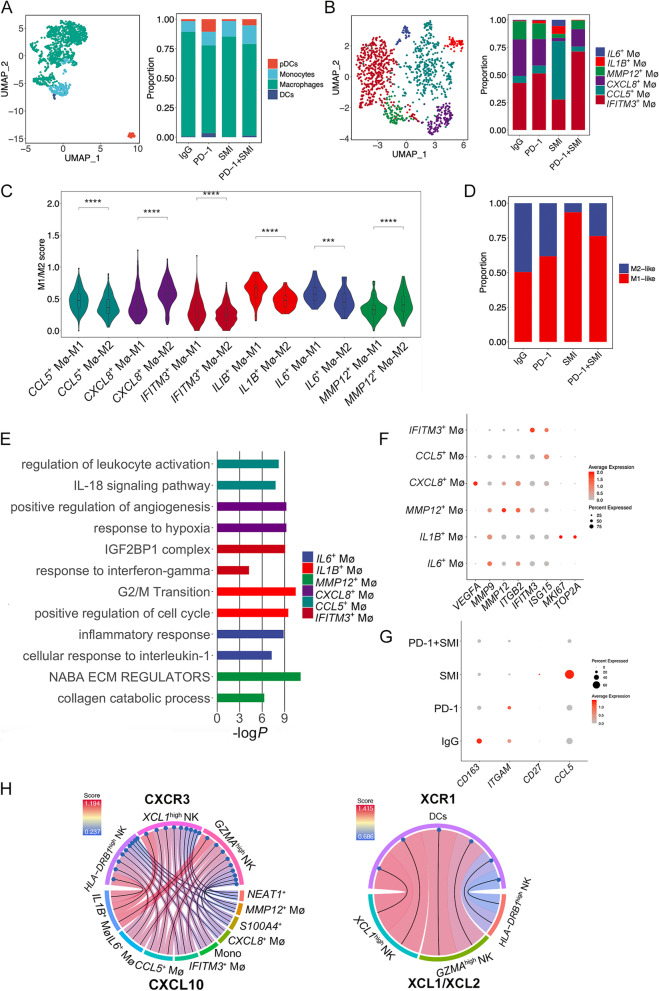
Fig. 6.
The proportion of M2-like macrophages was decreased in the combination therapy. (A) UMAP of macrophages, monocytes, classical DCs, and plasmacytoid DCs, relative proportion of these four clusters in four different treatments were showed on the right. IgG: immunoglobulin G isotype control; PD-1: PD-1 immune-checkpoint blockade antibody; SMI: SMI monotherapy; PD-1+SMI: combination of anti-PD-1 and SMI. (B) UMAP of six macrophage subclusters. Relative proportion of these six clusters in four different treatments were showed on the right. (C) Violin plot showing the mean score of the M1 or M2 signature across six macrophage subclusters. ***P < 0.001, ****P < 0.0001. (D) Relative proportion of M1 and M2 cells in four different treatments. (E) Metascape analysis showing the top representative biological pathways of six macrophage subclusters. (F) Dot plot showing expression of VEGFA, MMP9, MMP12, ITGB2, IFITM3, ISG15, MKI67, and TOP2A in six macrophage subclusters. (G) Dot plot showing expression of CD163, ITGAM, CD27, and CCL5 in four different treatments of macrophages. (H) Chord diagram showing the ligand-receptor pair CXCL10-CXCR3 involved in interactions between three NK subclusters (particularly the GZMAhigh NK cells) and M1-like macrophages (IL1B+ Mø, IL6+ Mø, CCL5+ Mø, and IFITM3+ Mø) as well as S100A4+ and NEAT1+ tumor cells, and the ligand-receptor pair XCL1/XCL2-XCR1 was inferred between GZMAhigh NK cells and DCs and between XCL1high NK cells and DCs

