
Fig. 2.
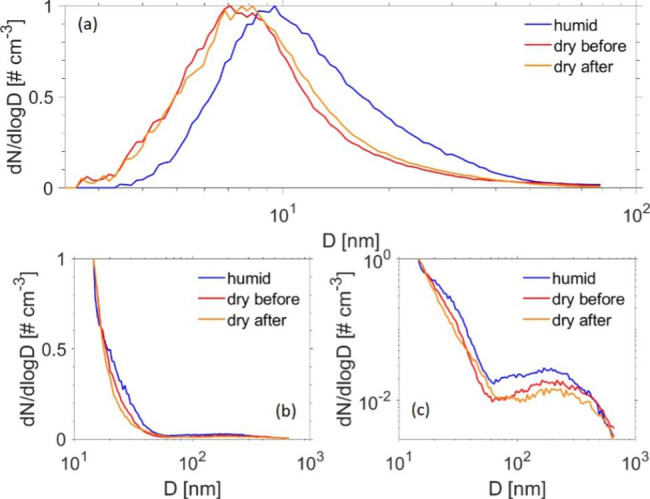
Normalized particle size distributions from candle experiments: Legend: (a) shows exposure session performed on 21.11.19 using nano DMA. (b) and (c) show exposure session performed on 05.11.19 using long DMA. Panels (b) and (c) show the same data but plotted with linear axis in (b) and logarithmic axis in (c) to better highlight the larger particle mode. Each curve was calculated as the median from 10 scans. The blue lines depicts the humidified distribution (RH ~ 90%), whereas the red and orange lines show the dry distributions recorded before and after the period of humidification (RH ~ 43%; conditions in the exposure chamber)