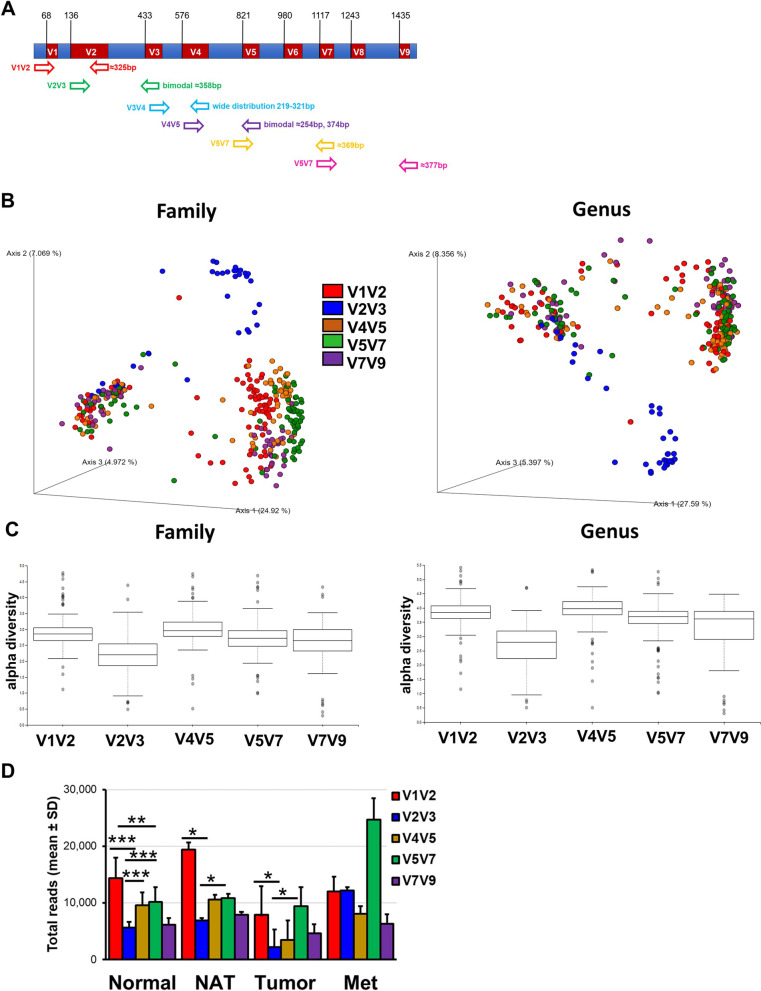
Fig. 1.
Variable regions analysis of the breast tissue. A Microbiome analysis of the breast was performed using primers covering all nine hypervariable regions of the 16S rRNA (V1V2, V2V3, V3V4, V4V5, V5V7, and V7V9). B Principal component analysis based on Bray–Curtis distance illustrating the differences between bacterial communities among 40 representative Normal samples via the indicated hypervariable regions at both family and genus level. C Shannon diversity index for each of the hypervariable region was determined at both family and genus level. D Total read values from the sequencing of each indicated hypervariable region for normal (Normal), normal adjacent to the tumor (NAT), tumor breast tissues (Tumor), and breast cancer metastasis (Met) samples. Nonparametric two-tailed Mann–Whitney U test was used for statistical analysis. *p < 0.05; **p < 0.001; ***p < 0.0001

