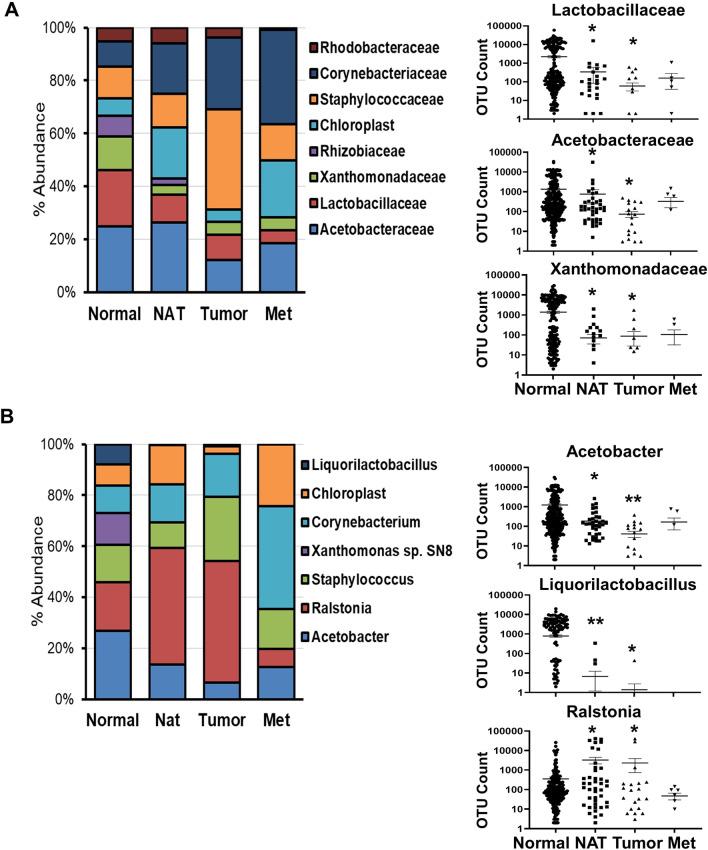
Fig. 2.
Bacterial abundance in breast tissues. Bacteria taxonomy was examined in the normal (Normal), adjacent normal (NAT), tumor breast tissues (Tumor) and breast cancer metastases (Met) at either family (A) and genus (B) level. Data from the V1V2 amplified region are shown. Most abundant bacteria (≥ 2% abundance) are displayed in the histobar graph on the left, whereas OTU count of the three most abundant bacteria is shown on the right as the scatter plot, where each dot represents a sample (value of 0 are not included because of the logarithmic scale). Nonparametric two-tailed Mann–Whitney U test was used for statistical analysis. *p < 0.05; **p < 0.001

