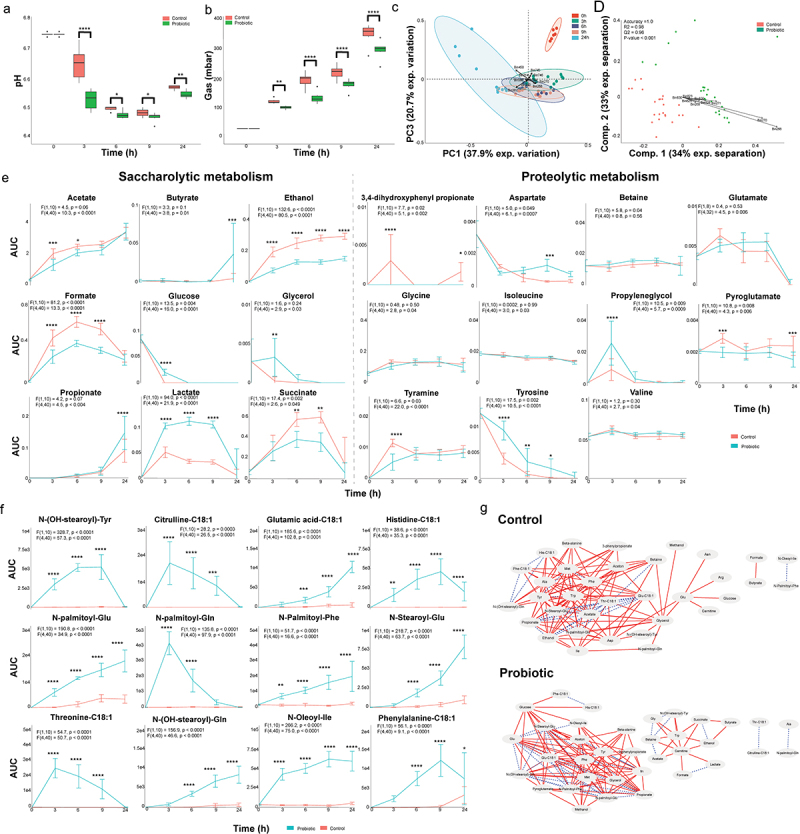
Figure 2.

A probiotic formula alters the metabolic environment when supplemented to ileostomy effluent.
(a) The mean and standard deviation of the pH measured at each timepoint. (b) The mean and standard deviation of the gas production at each timepoint. For panel B and C: Significance is obtained via a repeated measure two-way ANOVA with multiple comparison testing by controlling the false discovery rate according to the Benjamini-Hochberg procedure; *: q < 0.05, **: q < 0.01, ***: q < 0.001, ****: q < 0.0001. (c) Principal component analysis performed with the binned spectra as input. The ellipses represent the 95% confidence interval. The 10 bins contributing the most to the separation are indicated with arrows and belong to propionate (bin 214), acetate (bin 387 and 388), lactate (bin 268 and 270), acetone (bin 450), ethanol (bin 240) and an unidentified compound (bin 744, 745 and 746). (d) Partial least square – discriminant analyses performed with the binned spectra as input. The 9 bins contributing the most to the separation are indicated with arrows and belong to lactate (bin 268, 269, 270 and 271) and ethanol (bin 823, 825, 826, 828 and 830). The accuracy, R2 and Q2 values are statistical parameters which estimate the predictive ability of the model and are calculated via cross validation. The P-value is the results of a permutation test performed with the separation distance statistic and 1000 permutations. All parameters are calculated using MetaboAnalyst 5.0. (e) Dynamic profiles of the significantly different saccharolytic and proteolytic metabolites as obtained by measuring the area under the curve of a representative peak per metabolite. The error bars indicate the standard deviation. Significant differences are obtained via repeated measure two-way ANOVA. The F statistic and P value for the factor condition and for the interaction between time and condition are indicated for each metabolite. The result of multiple comparison testing by controlling the false discovery rate according to the Benjamini-Hochberg procedure is indicated with asterisks; *: q < 0.05, **: q < 0.01, ***: q < 0.001, ****: q < 0.0001. (f) Dynamic profiles of the significantly different and identified metabolites as measured the area under the curve obtained by LC-MS. The error bars indicate the standard deviation. Significant differences are obtained via repeated measure two-way ANOVA. The F statistic and P value for the factor condition and for the interaction between time and condition are indicated for each metabolite. The result of multiple comparison testing by controlling the false discovery rate according to the Benjamini-Hochberg procedure is indicated with asterisks; *: q < 0.05, **: q < 0.01, ***: q < 0.001, ****: q < 0.0001. (g) Dynamic correlation based networks of all metabolites measured in the control and probiotics-supplemented community. Nodes represent metabolites. Edges represents correlations between the two connected nodes and are obtained when 2/3 methods give a positive results; Kendall’s -0.8 > τ > 0.8, Spearman’s -0.8 > ρ > 0.8 and Brown’s randomization method with 1000 iterations has a Benjamini-Hochberg corrected P-value <0.05. The calculation of the edges is performed using the Cytoscape plugin CoNet. Red solid edges represent negative correlations, blue dashed edges represent positive correlations.
