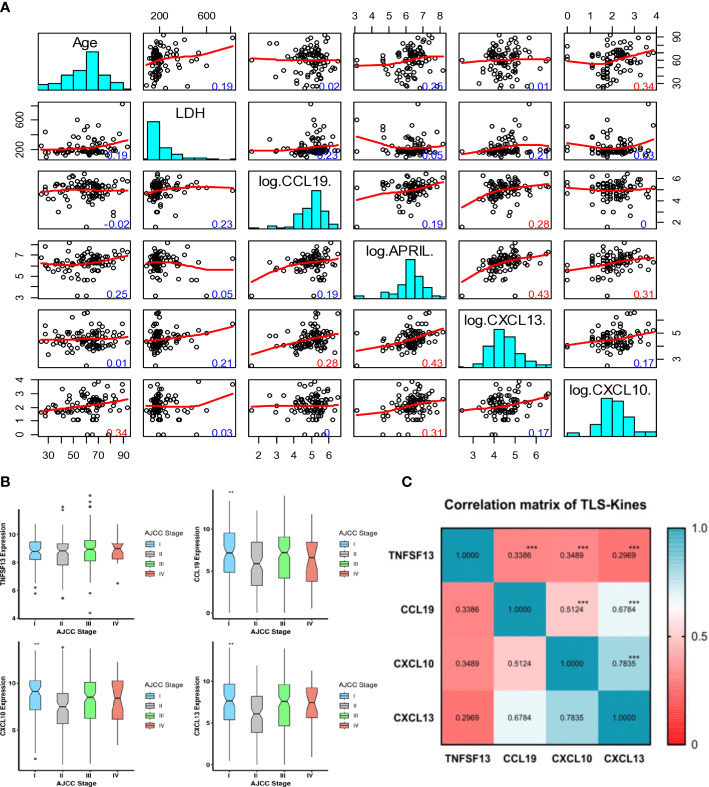
Figure 1.
Intervariable correlation between serum and tissue transcripts of TLS-kines and patients clinical indices. (A) Scatterplot matrix showing correlation between individual TLS-kines levels, LDH serum levels or patients Age. The y-axis in each plot representing age (row 1), LDH levels (row 2), CCL9 (row 3). APRIL (row 4), CXCL13 (row 5), CXCL10 (row 6) and the x-axis being the intersecting factor from adjacent rows. Red numbers highlight significant correlations (p < 0.01), blue numbers are not significant. (B) Box plots illustrating TLS-kines expression based on patients’ AJCC stage. CCL19, CXCL10 and CXCL13 transcript expression levels were significantly associated with tumor stage in the TCGA-SKCM cohort. P values were determined using the analysis of variance test (ANOVA). All p values < 0.05 were considered as significant. (C) Correlation of individual TLS-kine transcript levels with each other. Correlation matrix showing the association between TLS-kines in the TCGA-SKCM cohort. * p <.05, ** p <.01, *** p <.001. Each of these TLS-kines was significantly positively correlated with each other, with CXCL10 and CXCL13 having the highest correlation coefficient for coexpression (Pearson’s r = 0.783, p < 0.001).

