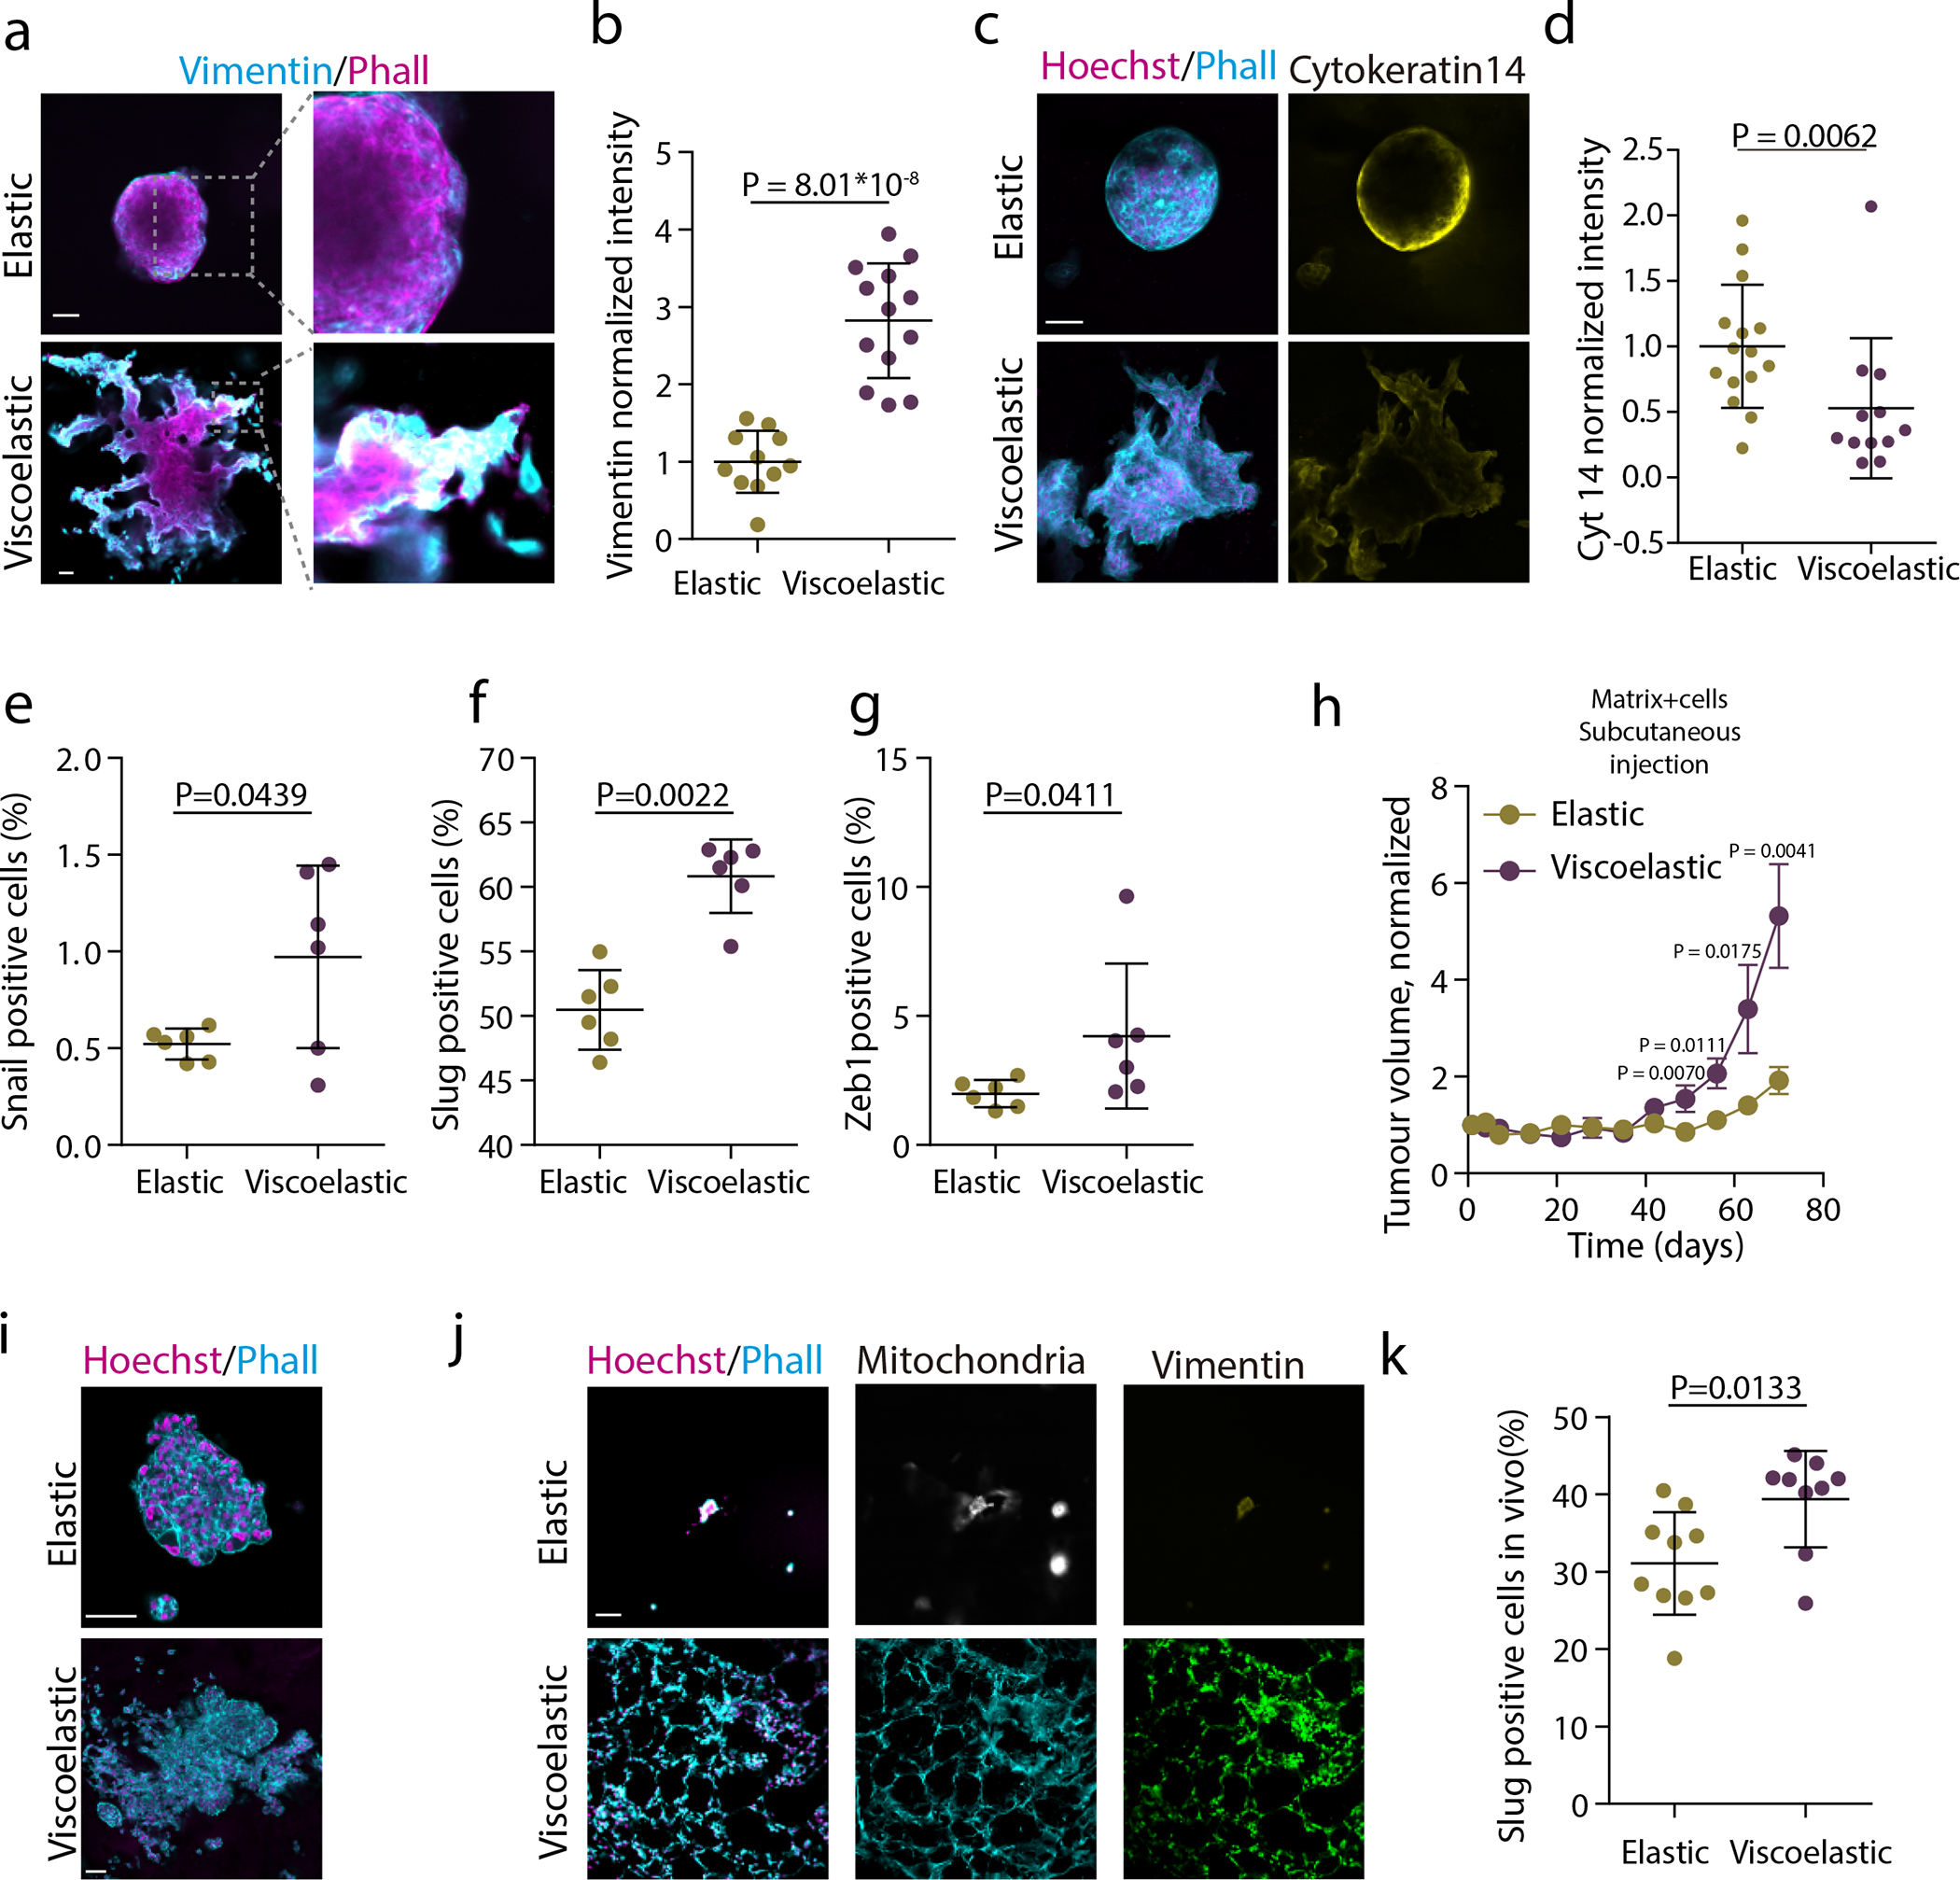
Figure 2. Matrix viscoelasticity promotes epithelial to mesenchymal transition and tumor growth.

a. Examples of vimentin, phalloidin and hoechst stainings in spheroids growing in viscoelastic gels. Insets shows the high expression of vimentin in the fingering instability arising from the spheroid. b, Quantification of average vimentin intensity in the outer ring of spheroids in elastic hydrogels and in fingers of spheroids in viscoelastic hydrogels. Average intensity of the elastic spheroid is normalized to 1. n=11,13 spheroids per condition. c. Examples of phalloidin, Hoechst (left) and cytokeratin 14 (right) stainings in spheroids in viscoelastic and elastic hydrogels. Phalloidin in cyan, Hoechst in magenta and cytokeratin 14 in yellow. d, Quantification of average cytokeratin 14 intensity of the outer ring of spheroids. Elastic spheroids average intensity is normalized to 1. n=12,15 spheroids per condition. e-g Quantification of percentage of Snail2 (e), Slug (f) or Zeb1(g) positive cells in spheroids in elastic and viscoelastic matrices. n=6,6 gels per condition. h, Quantification of the tumor volume in mice injected in day 0 with viscoelastic and elastic hydrogels containing MDA-MB-231 breast epithelial cells (error bars, s.e.m, n= 7 mice per condition). i, Representative examples of phalloidin and Hoechst stainings of MDA-MB-231 in elastic and viscoelastic hydrogels (n=8,7 images per condition). Phalloidin in cyan, Hoechst in magenta. j, Representative examples of phalloidin, hoechst (left), mitochondria (center), vimentin (right) stainings of MCF10A spheroids in viscoelastic and elastic hydrogels implanted in nude mice, 7 days after implantation (n=5,7 images per condition).k, Quantification of percentage of Slug positive cells in spheroids in elastic and viscoelastic matrices implanted in mice, 7 days after implantation. n=10 gels per condition. Statistical analysis was performed using two-sided Mann-Whitney U-test. All data are mean ± s.d. except where indicated, scale bars are 75 μm.
