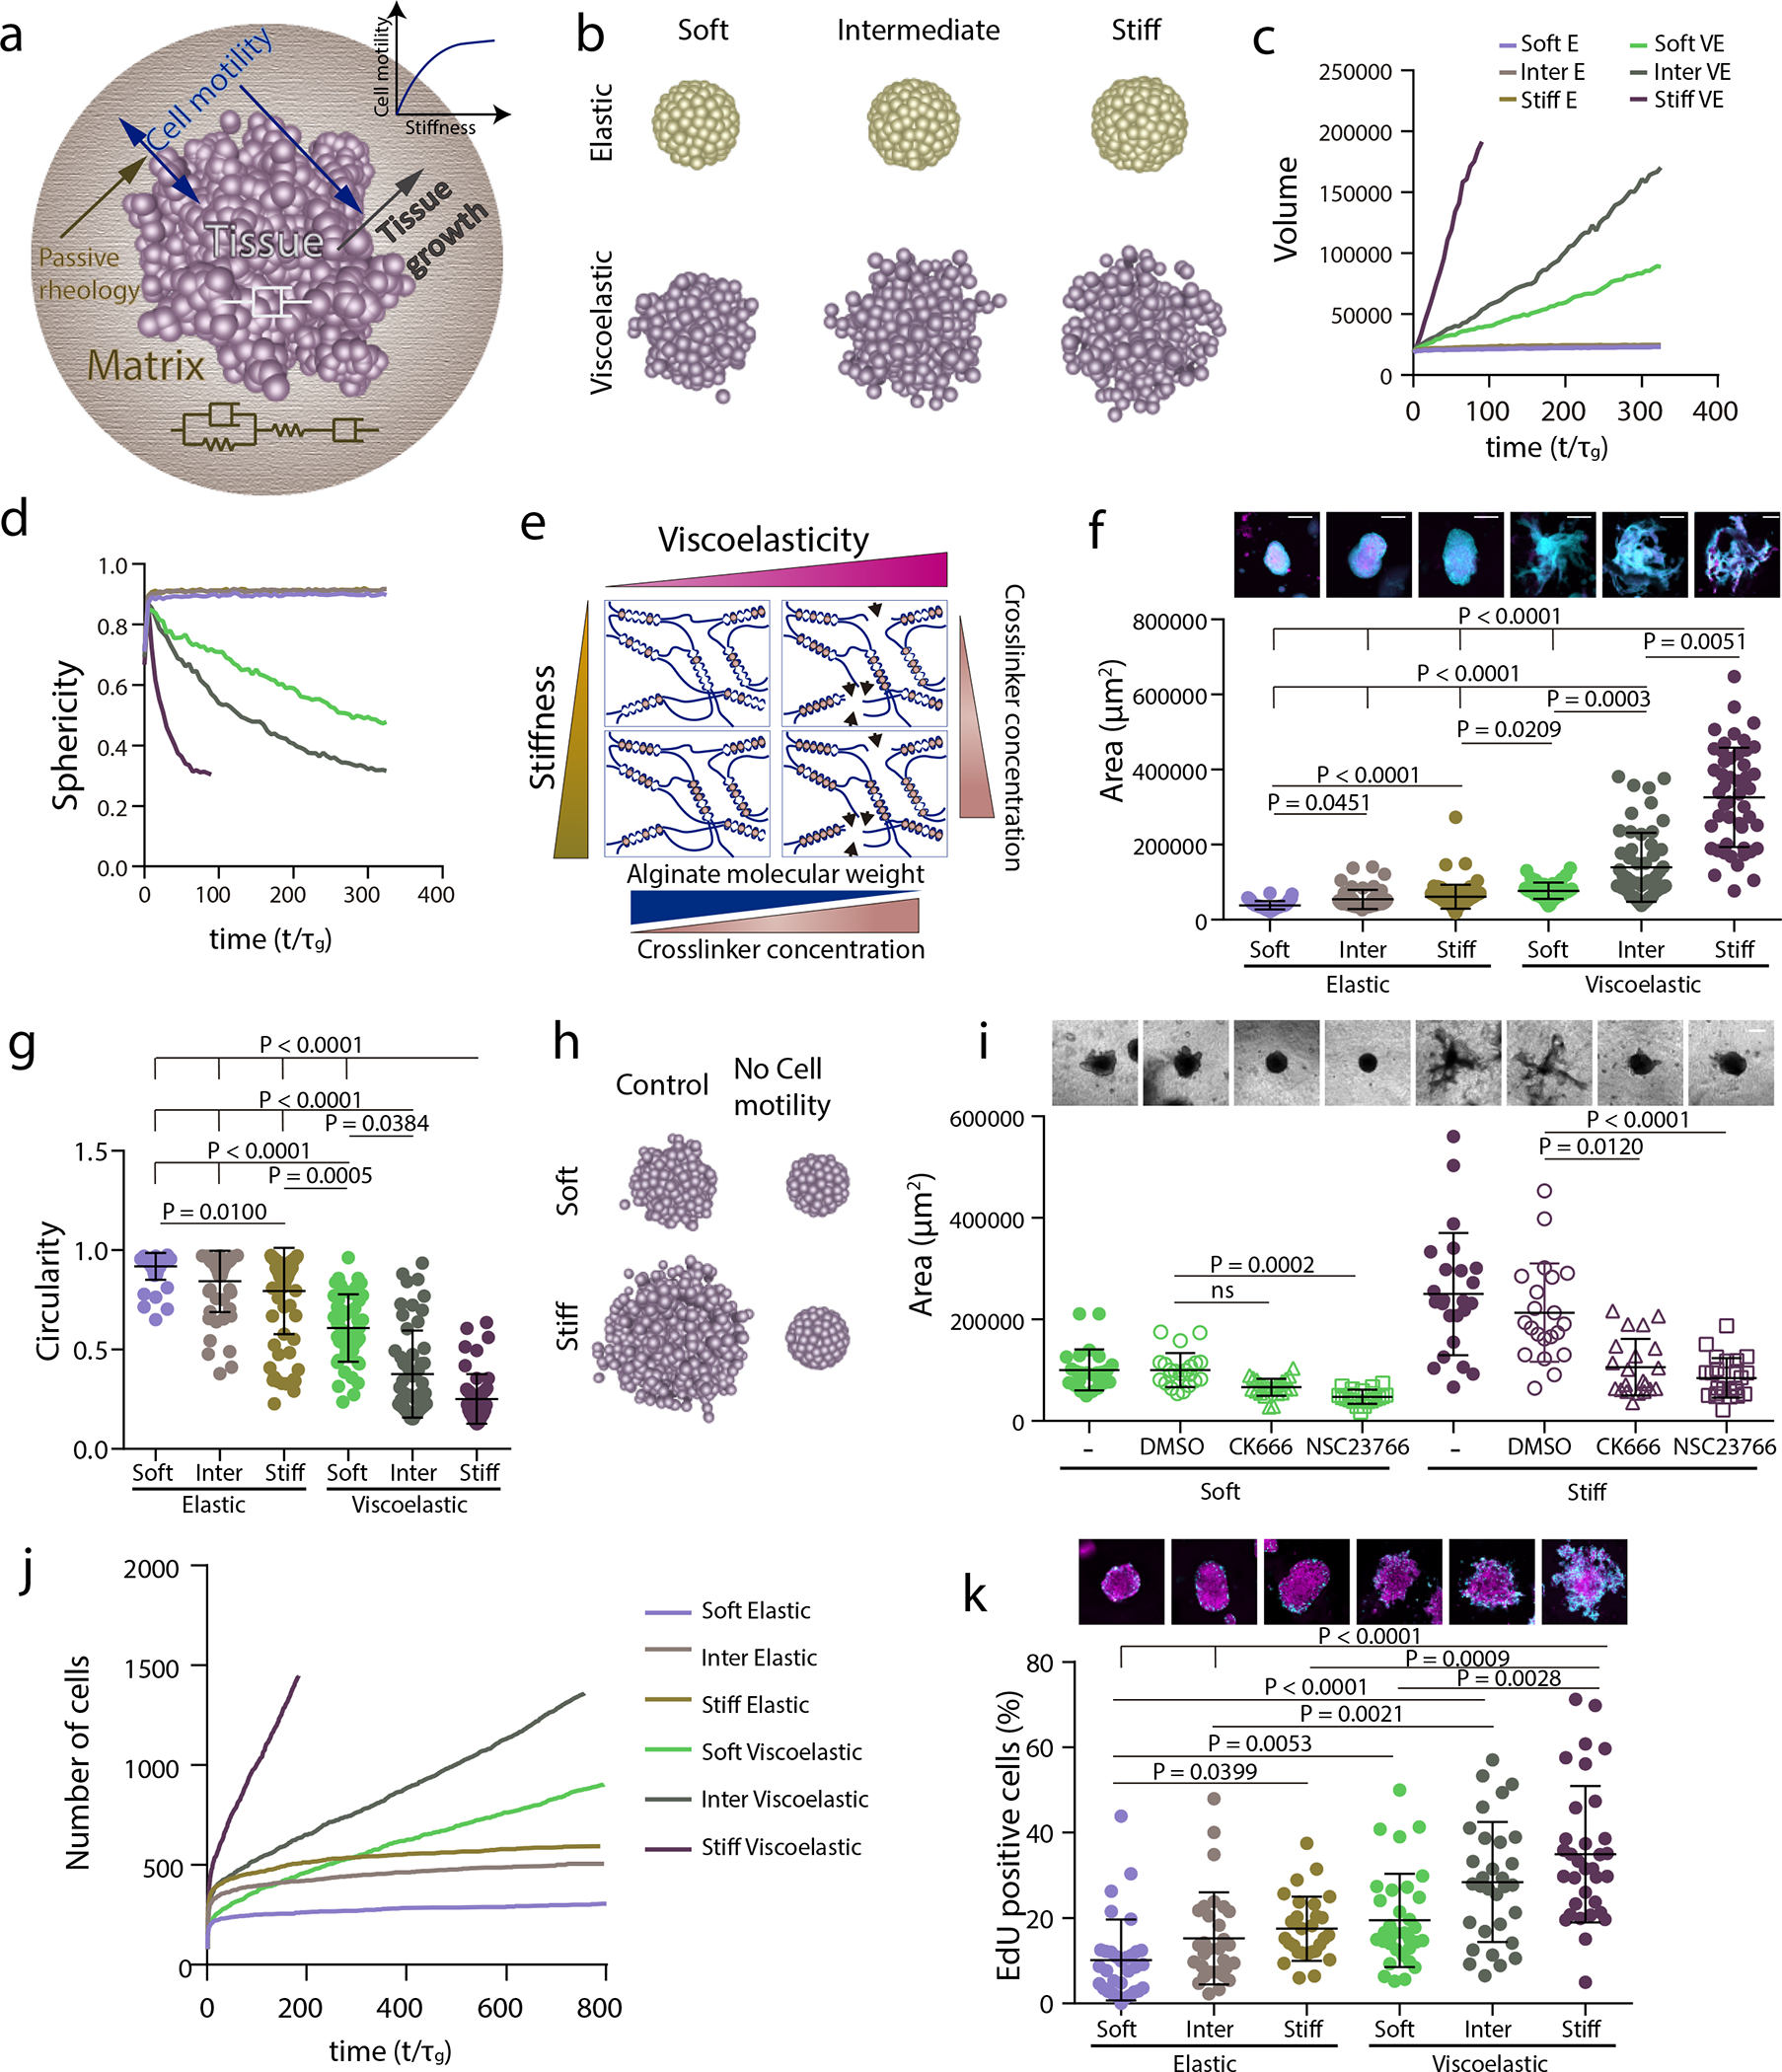
Figure 4. Stiffness intersects with matrix viscoelasticity to regulate growth and branching.

a, To incorporate the matrix stiffness dependence on the tissue property, now the active motility of the tissue is an increasing function of the matrix stiffness. Which makes the active motility a dependent parameter and in turn it also affects the tissue growth. b-d, 3D final timepoint simulation images (b), projected area (c) and circularity (d) evolution over time of spheroids in increasingly stiff elastic and viscoelastic gels. e, Stiffness of experimental matrices was modified by further altering the extent of crosslinking in both elastic and viscoelastic gels. f, Representative experimental examples (upper row) and quantification of spheroid area (lower row) after 5 days in elastic and viscoelastic matrices of increasing stiffness. n=63,55,84,50,55,50 spheroids per condition. Statistical analysis was performed using Kruskal– Wallis test followed by post hoc Dunn’s test. g, Quantification of spheroid circularity after 5 days in elastic and viscoelastic matrices of increasing stiffness. n=63,55,84,50,55,50 spheroids per condition. Statistical analysis was performed using Kruskal–Wallis test followed by post hoc Dunn’s test. h, Representative model simulation results when cell motility is eliminated in stiff viscoelastic matrices compared to soft viscoelastic matrices. i, Representative experimental examples (upper row) and quantification of spheroid’s area (lower row) after 5 days in soft and stiff viscoelastic matrices with Rac1 (NSC23766) and Arp2/3 (CK666) inhibitors. n=25,22,27,21,24,21,21,24 spheroids per condition. Statistical analysis was performed using Kruskal–Wallis test followed by post hoc Dunn’s test. j, Model predictions for cell proliferation in spheroids of increasing stiffness for both elastic and viscoelastic gels. k, Representative experimental examples (upper row) and quantification of the percentage of EdU positive cells in a spheroid (lower row) after 5 days in elastic and viscoelastic gels of increasing stiffness. n=32,30,28,33,31,33 spheroids per condition. Statistical analysis was performed using Kruskal–Wallis test followed by post hoc Dunn’s test. All data are mean ± s.d., all scale bars are 200 μm.
