
Extended Data Figure 2.
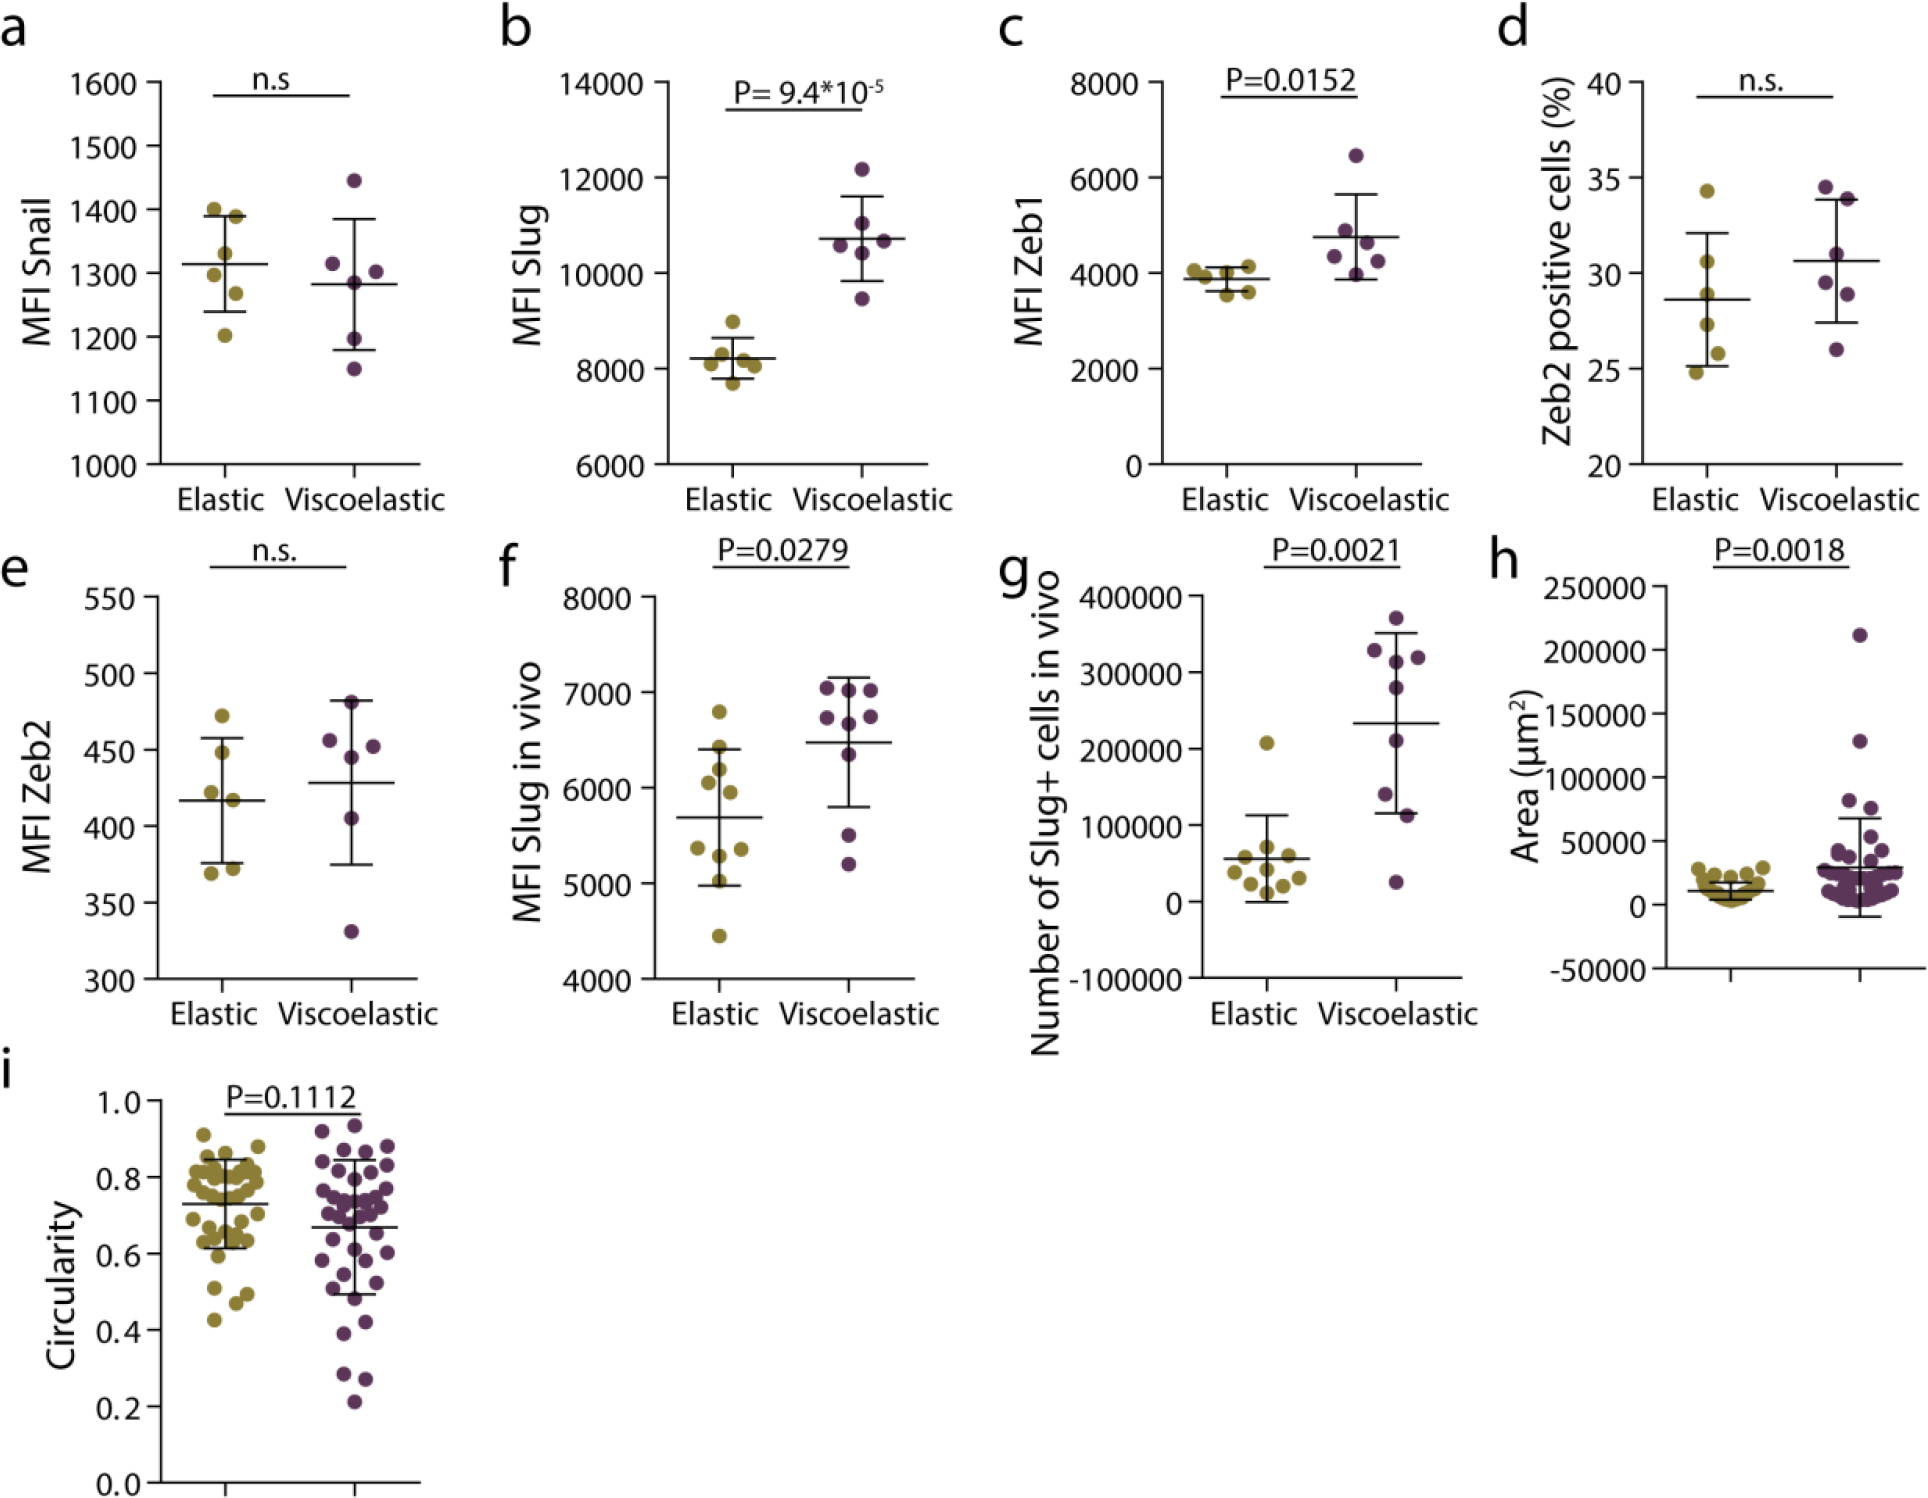
Matrix viscoelasticity promotes epithelial to mesenchymal transition. a-c, quantification of mean fluorescence intensity of Snail, Slug and Zeb1 in spheroids in elastic and viscoelastic matrices. n=6 gels per condition. d-e, quantification of percentage of Zeb2 positive cells (d) and mean Zeb2 fluorescence intensity (e) in spheroids in elastic and viscoelastic matrices. n=6 gels per condition. f, quantification of mean fluorescence intensity of Slug cells in elastic and viscoelastic matrices encapsulated in vivo (n=9,10 gels per condition). g, quantification of number of Slug positive cells in spheroids in elastic and viscoelastic matrices encapsulated in vivo (n=9,10 gels per condition). h-i, quantification of the area (h) and circularity (i) of MDA-MB-231 spheroids encapsulated in elastic and viscoelastic matrices. n=40 spheroids per condition. Statistical analysis was performed using two-sided Mann-Whitney U-test. All data represent mean ± s.d.