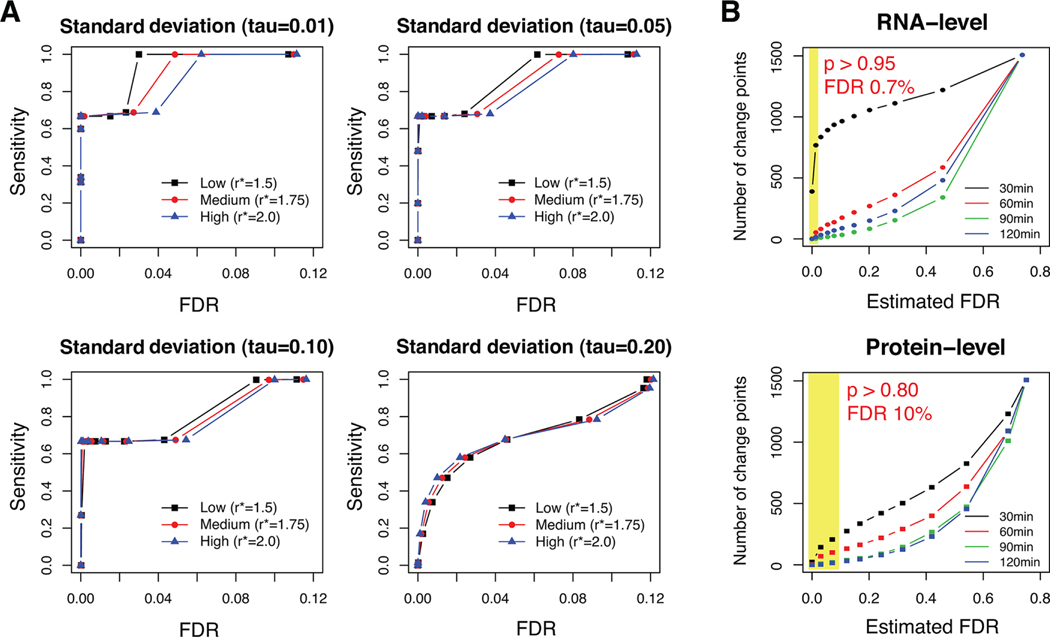
Figure 2.
(A) Simulation results. The sensitivity of PECA was plotted against the FDR under various scenarios of signal-to-noise ratio. The four panels show the pseudo-receiver-operating characteristic (ROC) curve in four different noise levels (), where the horizontal axis represents the false discovery rates, instead of the conventional values in the horizontal axis (1– specificity). In each panel, three different signals () were planted, representing from low to modest coefficient of variation. (See the Supporting Information.) (B) Number of selected (significant) change points at the RNA and protein level at respective probability thresholds. (See the justification of target FDRs in the main text.) The yellow rectangles show the selection region at the respective significance levels.

