. 2023 Jun 16;148(14):3247–3256. doi: 10.1039/d3an00751k

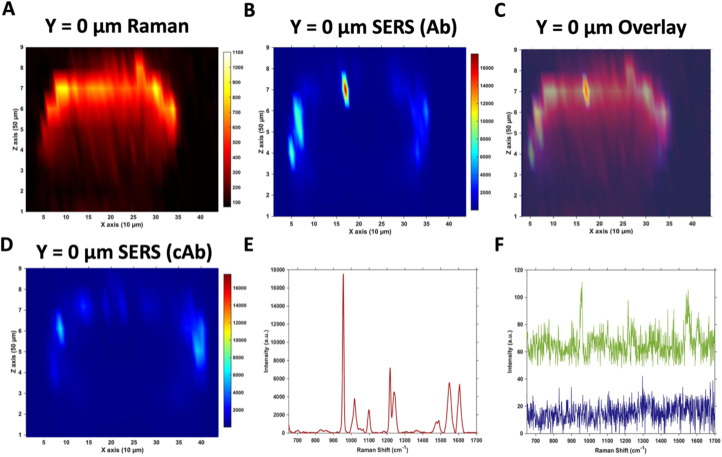
Fig. 1. Raman and SERS measurements of U87-MG GBM MTS incubated with 32 pM Ab and cAb nanotags for 4 hours. (A) 2D XZ Raman intensity map at 2930 cm−1 showing the CH3 cellular protein peak obtained using 532 nm laser excitation taken at y = 0 μm of the MTS. (B) 2D XZ SERS intensity maps at 956 cm−1 corresponding to the main intensity peak of the Raman reporter PPY on the Ab nanotags obtained using 785 nm laser excitation taken at y = 0 μm of the MTS. (C) Overlay of (A) and (B) to illustrate the nanotag signal is within the outer layer of cells of the MTS. (D) 2D XZ SERS intensity maps at 956 cm−1 corresponding to the main intensity peak of the Raman reporter PPY on the cAb nanotags obtained using 785 nm laser excitation taken at y = 0 μm of the MTS. (E) SERS spectrum of the Ab nanotags at the most intense area of (B) and (F) SERS spectra of the Ab nanotags from the centre of (B) (green) and from a point on the coverslip away from the spheroid (blue). All spectra were taken using a 1 s integration time and 100% laser power (785 nm, 20 mW and 532 nm, 30 mW). All measurements were taken on n = 3 MTS.

Fig. 1