. 2023 Jun 16;148(14):3247–3256. doi: 10.1039/d3an00751k

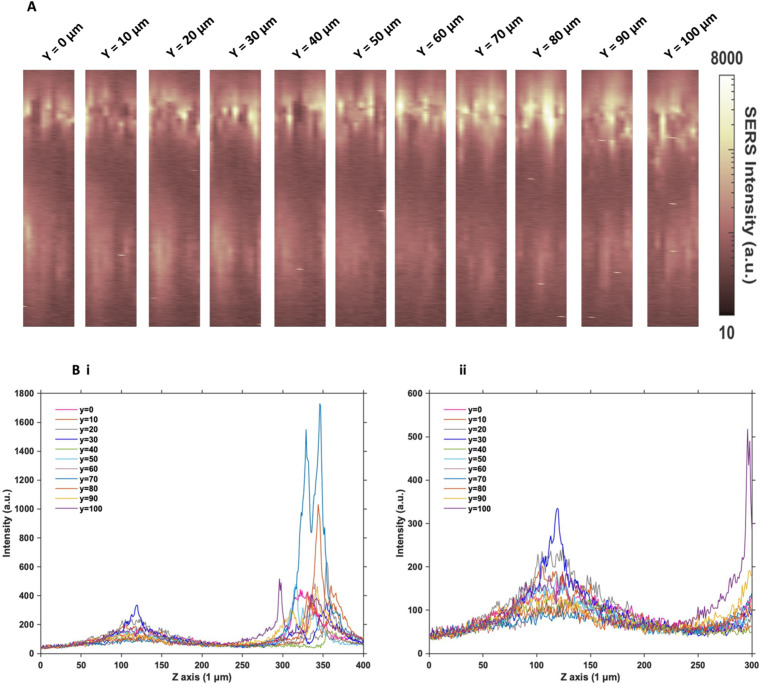
Fig. 2. Z optical sectioning through U87-MG GBM MTS incubated with 32 pM Ab nanotags for 4 hours. (A) 3D SERS intensity maps at 956 cm−1 corresponding to the intensity of the main peak of the Raman reporter PPY on the nanotags. From left to right illustrates an increasing y plane taken throughout the entirety of the MTS at 10 μm increments. (B) Z profile for the PPY intensity illustrating the localisation of the Ab nanotags throughout the entire Z profile of the MTS where (i) shows the full Z range and (ii) is an expanded spectrum of the 0 to 300 μm region to show the signal at the bottom of the MTS. Spectra were taken using a 785 nm laser excitation, 1 s integration time and 100% laser power at 20 mW. All measurements were taken on n = 3 MTS.

Fig. 2