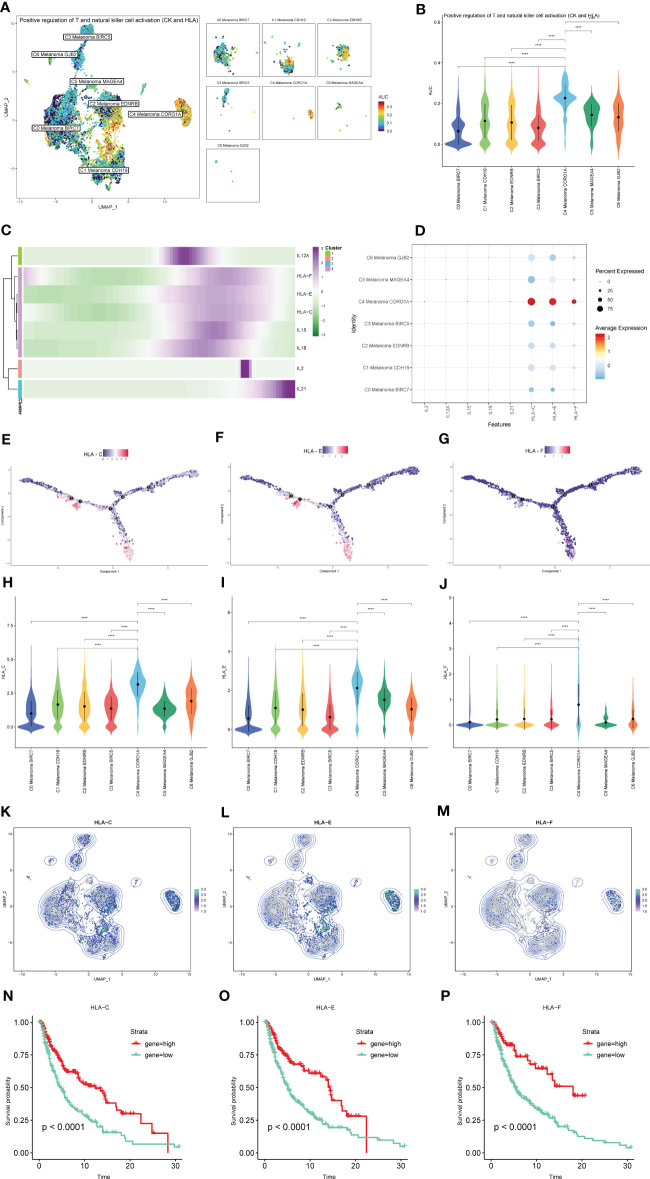
Figure 10.
The expression of positive regulation of NK and T cell activation-related genes in subtypes of melanoma cells. (A, B) Differences in positive regulation of NK and T cells activation-related genes activities scored per cell by AUCell among melanoma cell subtypes. (C) Heatmap depicting the scaled expression of positive regulation of NK and T cells activation-related genes of melanoma cell subtypes, as classified into four major gene clusters. (D) The dot plot shows the expression of positive regulation of NK and T cells activation-related genes. (E–G) The expression of HLA-C, HLA-E, and HLA-F in pseudotime trajectories of subtypes of melanoma cells. (H–M) The UMAP plots and violin plots show the differential expression of HLA-C, HLA-E, and HLA-F among subtypes of melanoma cells. (N–P) Kaplan-Meier survival plots of the high and low gene groups for HLA-C, HLA-E, and HLA-F. ****P < 0.0001.

