Figure 11.

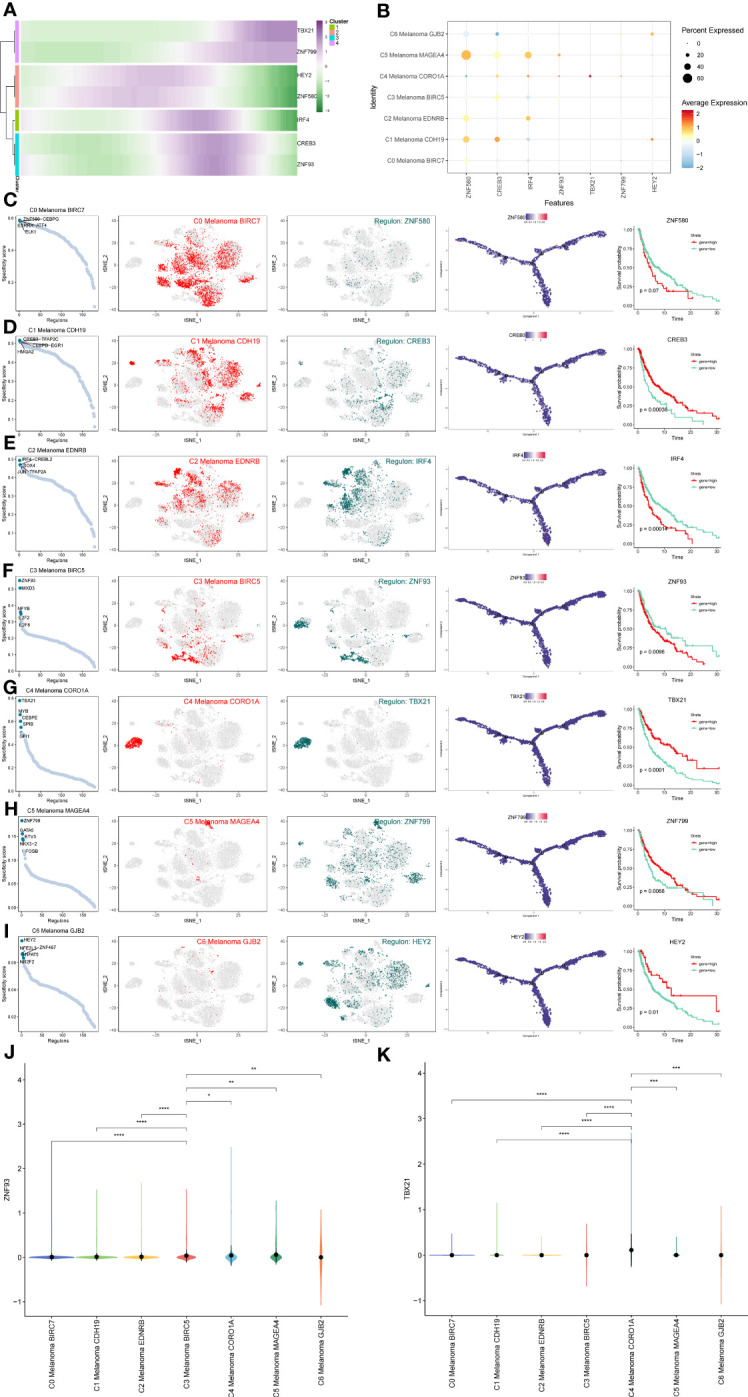
Gene regulatory network analysis of melanoma cell subtypes. (A) Heatmap depicting the scaled expression of TBX21, ZNF799, HEY2, ZNF580, IRF4, CREB3, and ZNF93 among melanoma cell subtypes, as classified into four major gene clusters. (B) The dot plot shows the expression of these TFs. (C–I) Rank for regulons in melanoma cell subtypes based on regulon specificity score (RSS). Melanoma cell subtypes are highlighted in the t-SNE (red dots). Binarized regulon activity scores (RAS) for the top regulon of melanoma cell subtypes on t-SNE (perform Z score normalization across all samples, and set 2.5 as the cutoff to convert to 0 and 1) (dark green dots). Kaplan-Meier survival plots of the 7 key TFs of melanoma cell subtypes. (J, K) The violin plots show the expression of ZNF93 and TBX21 in melanoma cell subtypes. *P < 0.05, **P < 0.01, ***P < 0.001, ****P < 0.0001.
