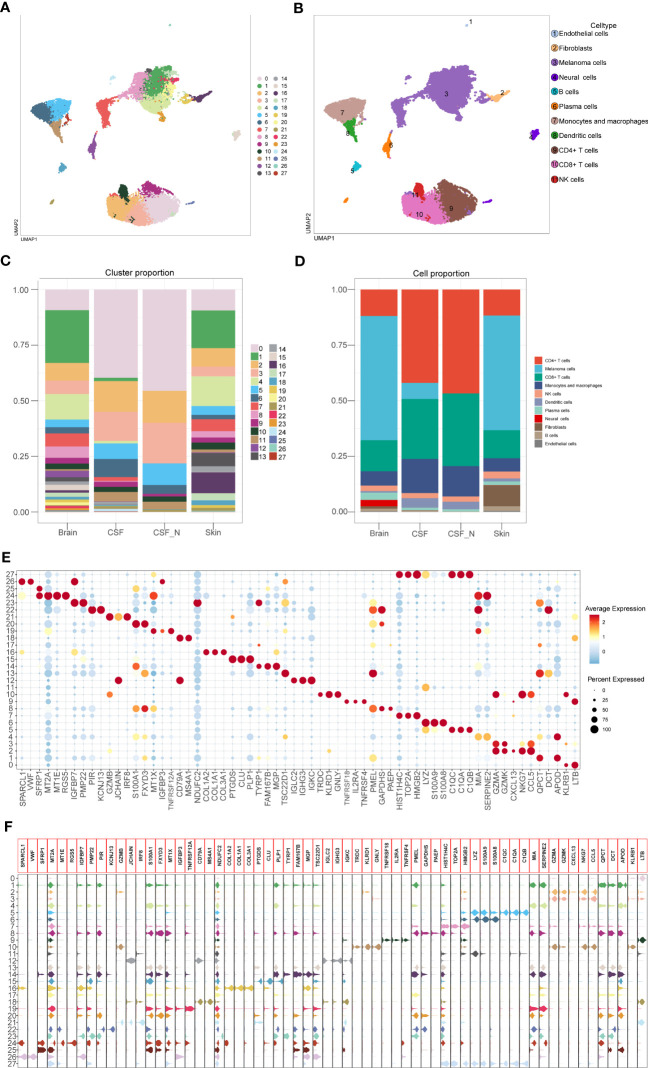
Figure 2.
Identification of the cell types based on specific markers among 28 clusters. (A) The 2D plots of UMAP dimensionality reduction of the 26,161 high-quality cells. (B) The 2D plots of UMAP dimensionality reduction of cell type. (C, D) The percentage of clusters and cell types between tissues was represented on a proportion chart. (E, F) Dot plot and violin plot showing top3 marker genes for 28 clusters.

