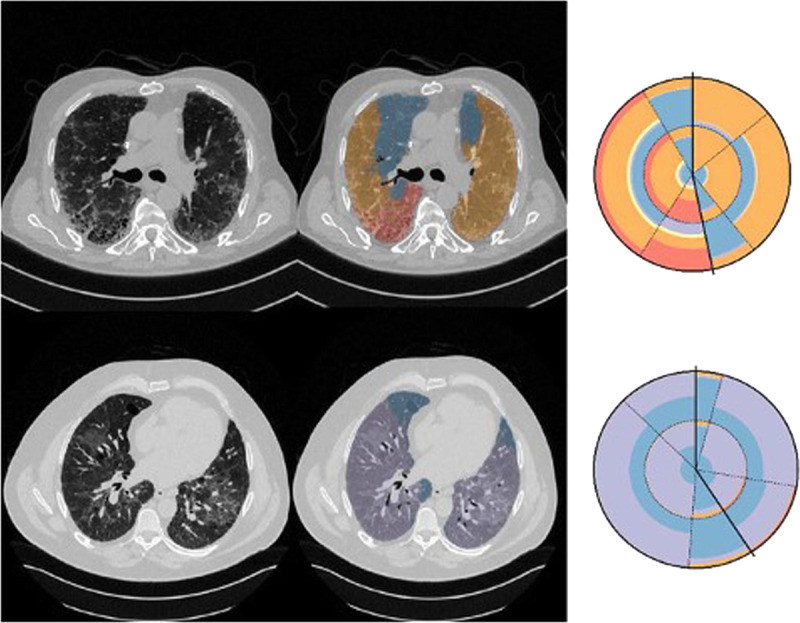
FIGURE 3.

Quantification of pathological interstitial lung tissue (middle column) and visualisation using radial histograms (right column).25 Each sector denotes a region of the lung and is split into 2 parts, one for the central (inner) and one for peripheral (outer). Solid lines denote the division of left and right lungs. Top case is a typical UIP with reticulation (orange) and honeycombing (red) and bottom a non-IPF with ground glass opacity (purple).
