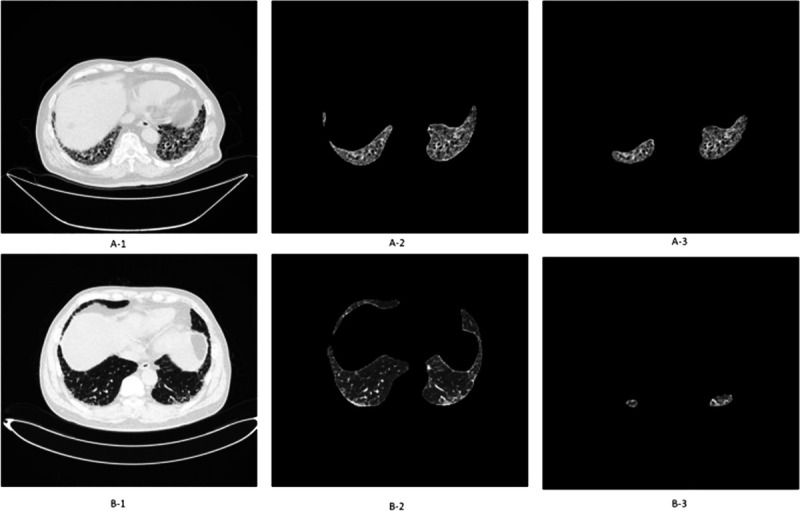
FIGURE 4.

Quantifying pulmonary fibrosis I: comparing the original CT image (A-1 and B-1) with the automatically segmented honeycombing regions (A-2, A-3, B-2, B-3) to calculate the fibrosis percentage. A, Area of honeycombing is 5% to 25% of the entire lung (CT stage II). B, Area of honeycombing is <5% of the entire lung (CT stage I).39
